POSITION RESET
Contents
- The global position reset is a fact: systematic funds have flipped from maximum selling to maximum buying, mass short covering is breaking historical records, market structure now supports acceleration to the upside, and large funds are betting on higher prices.
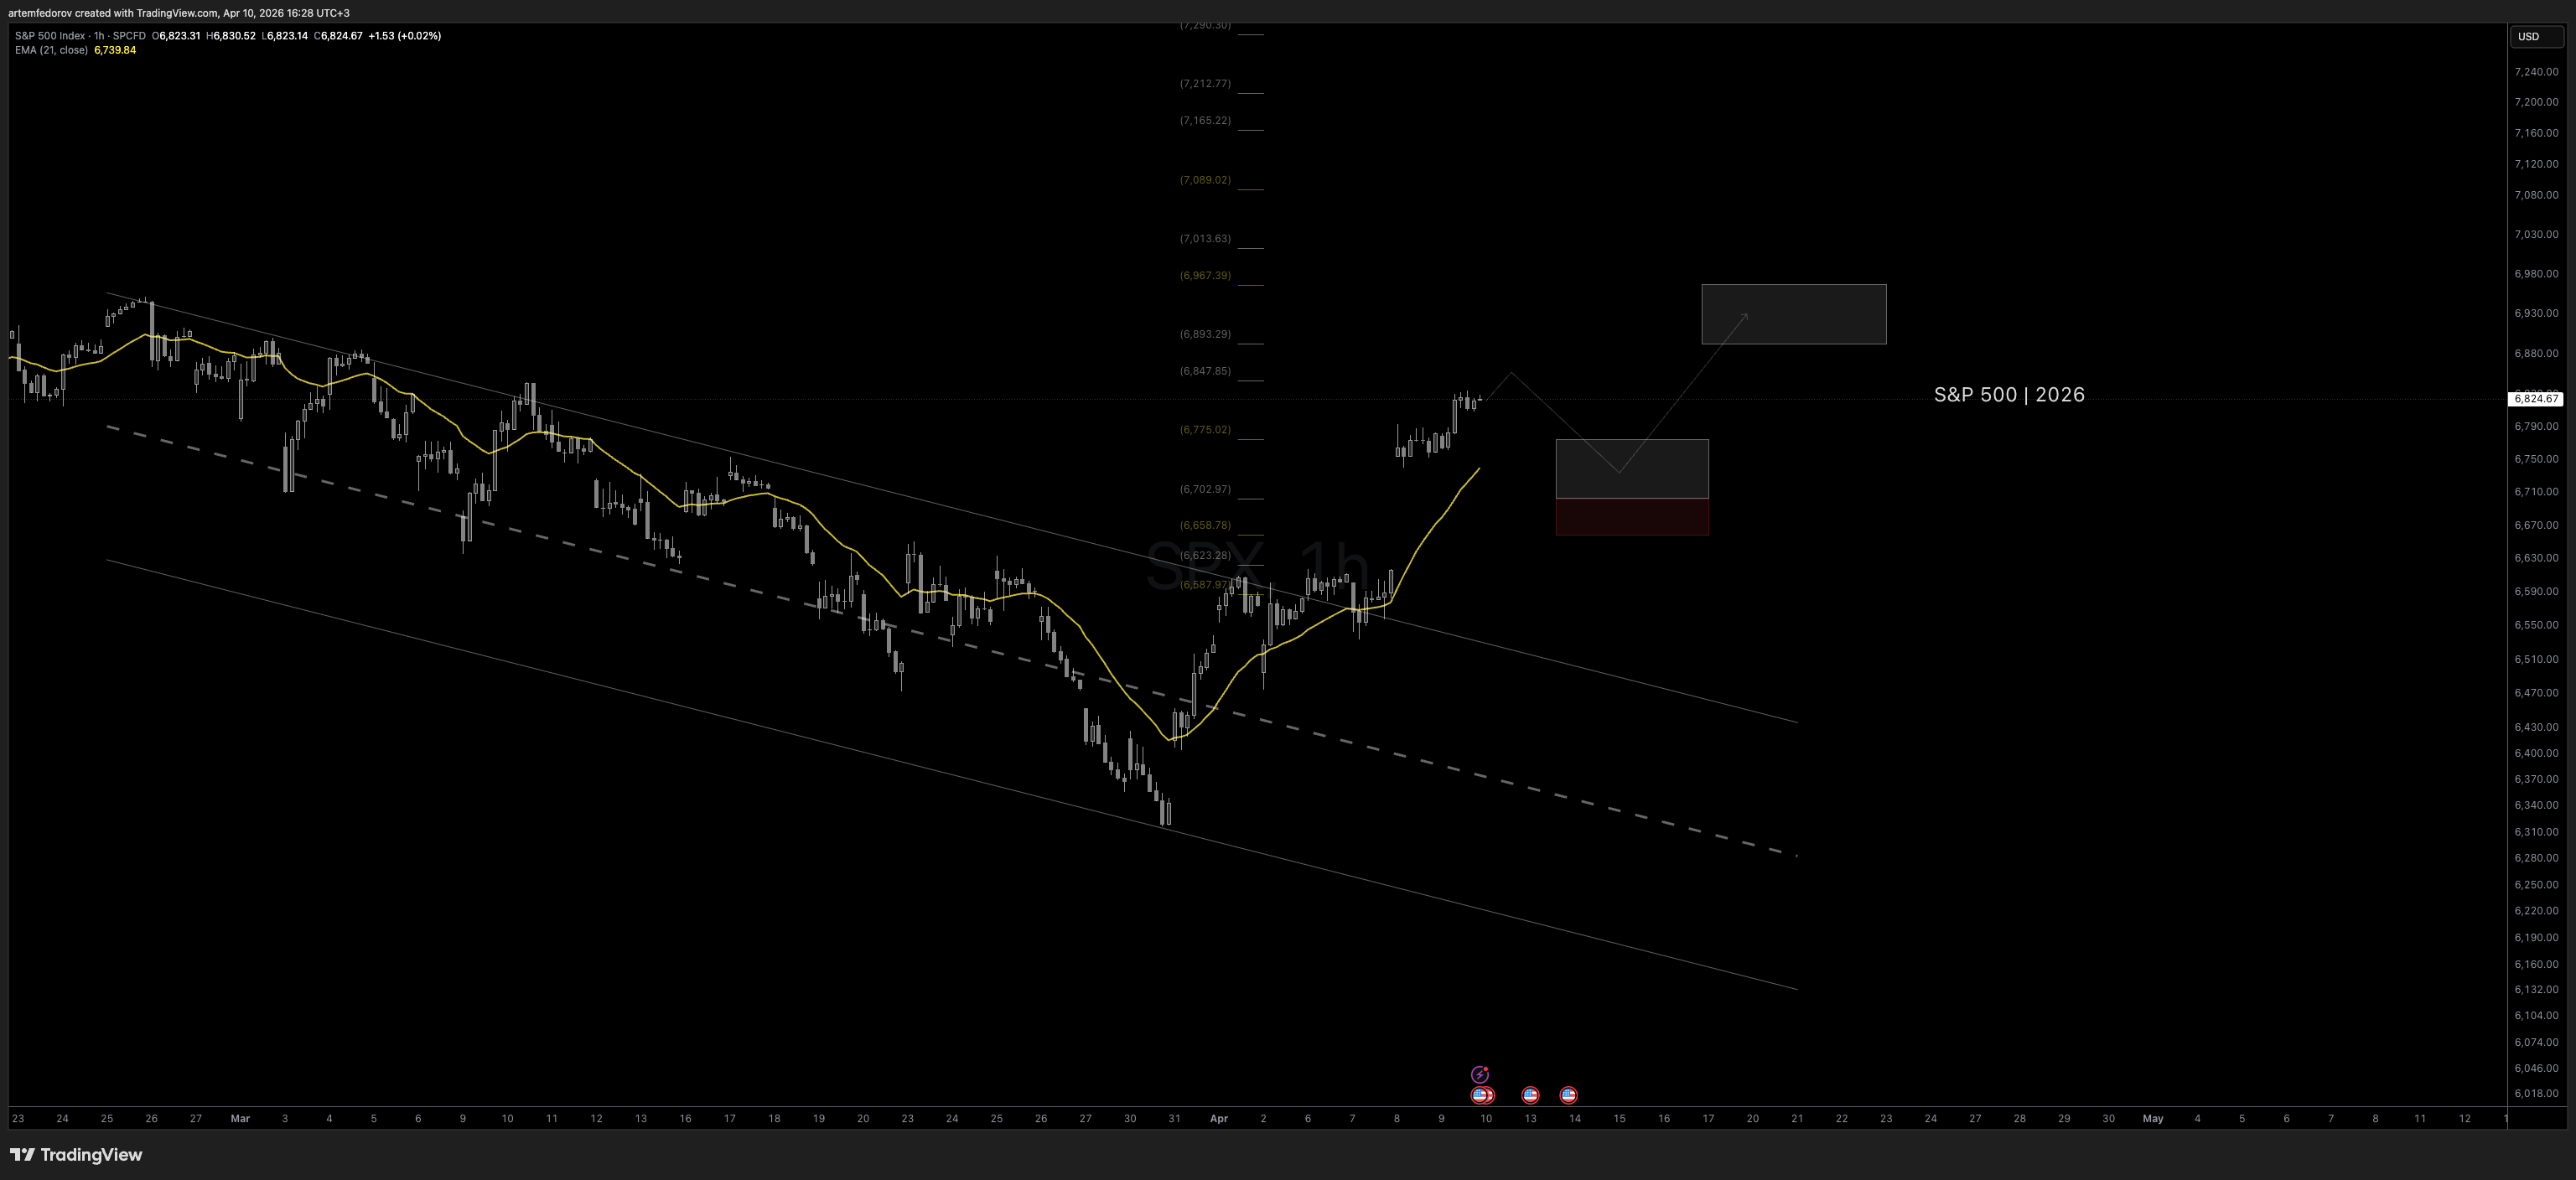
- However, the broad market index has already retraced its entire drawdown and sits in the middle of its range, approaching overbought territory.
- The easy part of the move is behind us. We'll now watch closely how the next pullback behaves.
- If the market holds local support levels on a retest, that sets up high-quality risk/reward to add longs.
OVERVIEW
The market is attempting a full reversal — since the correction began earlier this year, the internal structure of player positioning has completely changed. We break down what's behind the move, who drove it, and what it means going forward.
SYSTEMATIC FUNDS (CTA) CAUGHT OFFSIDE
Heading into this week, trend-following CTAs were short nearly $40bn of US equities — per Goldman Sachs, one of the largest short positions of the past decade. They sold aggressively into the recent drawdown and stayed short as the market began to turn.
Now these algos have flipped to active buying. Over the next week they're projected to buy roughly $45bn of US equities even in a flat tape — the second-largest projected buy on record. Classic CTA behavior: sell the lows, buy the highs.
SHORT COVERING LIFTS THE MARKET
Yesterday saw one of the largest short-covering events in years — the biggest since August 2020. Data shows short exposure in US single stocks and ETFs has dropped back to early-March levels, though it remains elevated on a longer horizon. There's still more to cover, which can provide additional support to the recovery.
DEALER GAMMA FLIP CHANGES THE GAME
Earlier this year, dealers capped every rally — selling into strength. That has now flipped.
In plain English: rallies can now accelerate without heavy resistance, and dips are more likely to be cushioned by dealer buying. An important structural shift kicking in at the start of Q2.
INSTITUTIONS START BUYING
Per Vanda Research, yesterday saw the largest net institutional call buying since the start of the recent conflict. The notional size is still modest globally, but the direction matters — bearish positioning is starting to ease.
This was one of the five conditions we flagged late last month as necessary for a market bottom and resumption of the uptrend.
RETAIL STAYS ON THE SIDELINES
While large funds drive the market, retail has gone unusually quiet. Net buys yesterday totaled just $197M — the lowest since November 2023. Some of this is seasonality (the first half of April is historically weak for retail), but the bigger picture is clear: retail has shifted from buying dips to selling rallies, taking a defensive stance.
KEY TAKEAWAY
The global position reset is a fact: systematic funds have flipped from maximum selling to maximum buying, mass short covering is breaking historical records, market structure now supports acceleration to the upside, and large funds are betting on higher prices.
However, the broad market index has already retraced its entire drawdown and sits in the middle of its range, approaching overbought territory. The easy part of the move is behind us.
We'll now watch closely how the next pullback behaves. If the market holds local support levels on a retest, that sets up high-quality risk/reward to add longs. The real opportunity isn't chasing — it's entering after strength is confirmed.
Stay sharp.
Keep following this theme
Public commentary in Telegram is free. Members also get entries, stops and targets on these themes in Telegram and on the dashboard, and every closed trade is logged in the public track record.
Get notified when we open the first position
One short email when we act on this theme. Unsubscribe in one click.
Published