
01
The Mood Begins to Shift
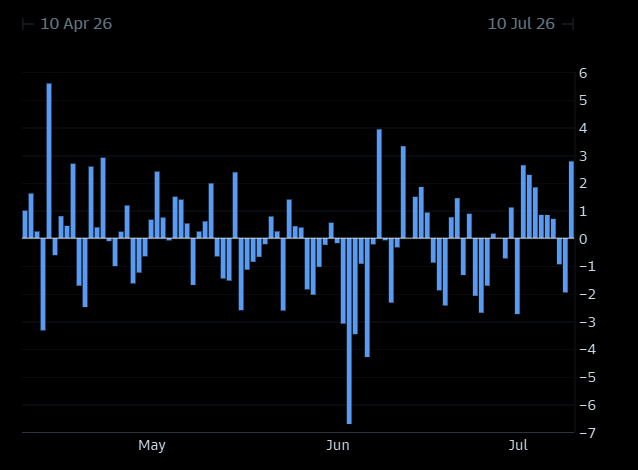
Bitcoin has been moving lower since mid May, but the market tone may be starting to soften. The chart shows how daily price changes have evolved over the past three months. Late May and June were marked by frequent losses and several sharp selloffs. In early July, positive sessions began to appear more often, while rebounds became stronger and held for longer.
This does not confirm that a bottom is already in place. The sequence of daily returns simply suggests that selling pressure may be losing some of its force and buyers are beginning to respond more confidently to weakness.
02
Capital Returns. Lets wait for conviction
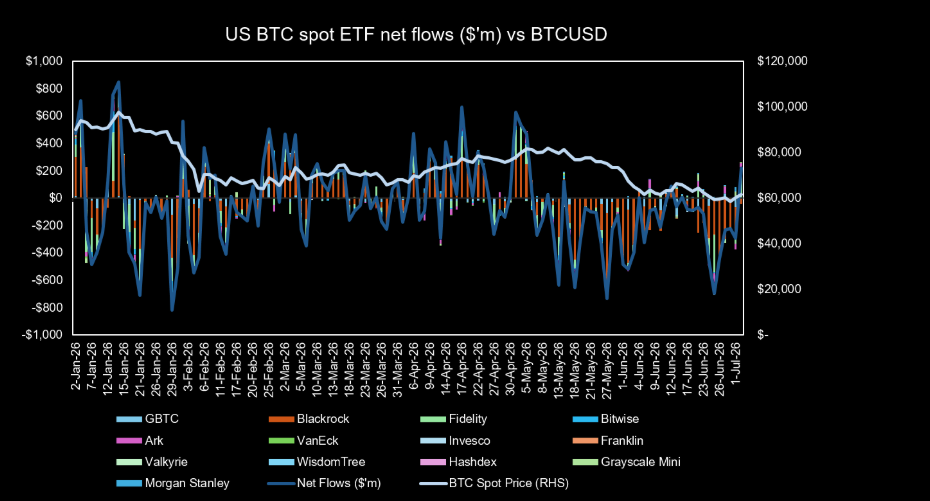
The first encouraging signal came from US spot Bitcoin ETFs. On July 2, they recorded a $221.7 million net inflow, the strongest daily result during an eight week period dominated by outflows. This may indicate that institutional demand is beginning to return.
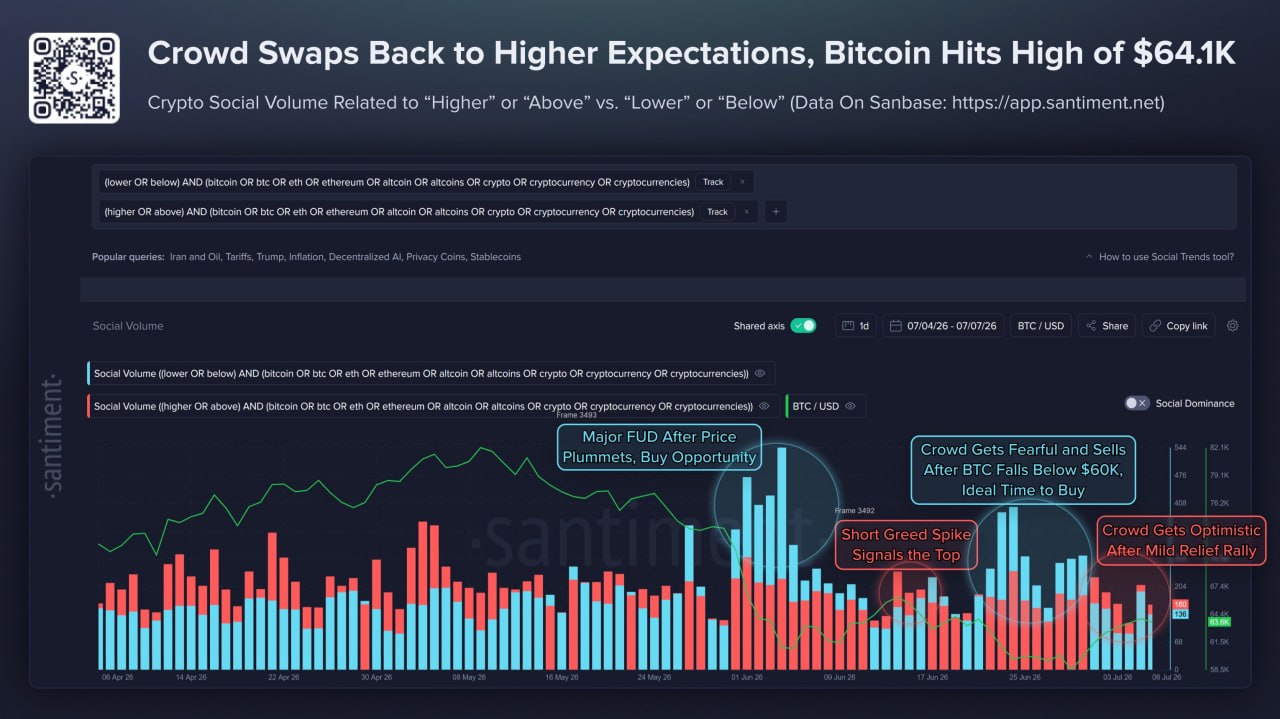
But the signal remains incomplete. IBIT, still the largest fund in the group, continued to see outflows. At the same time, retail optimism recovered quickly as Bitcoin bounced. Sentiment is warming, but a durable recovery would probably require several strong flow days rather than a single bright print.
03
A Rare Oversold Reading
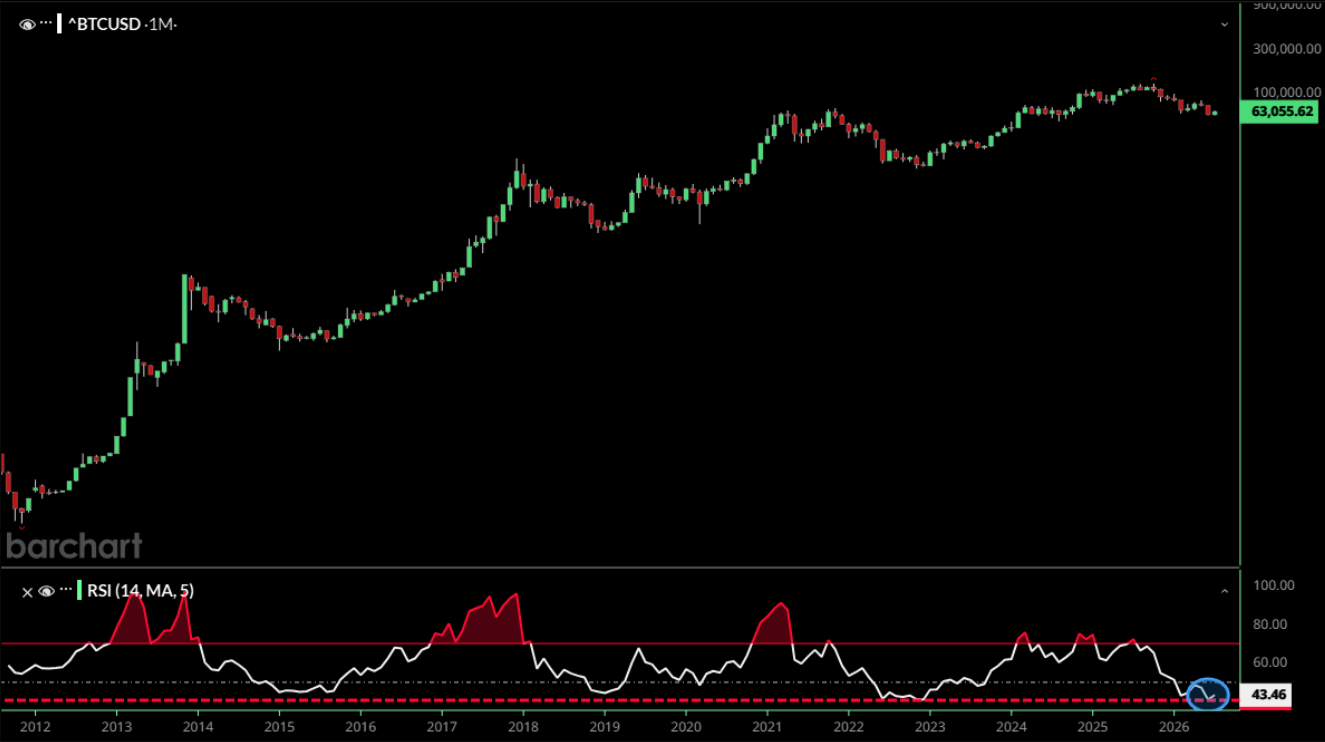
On the monthly chart, Bitcoin has fallen to its second most oversold reading on record. The only deeper reading appeared in December 2022, near the beginning of a three year advance that eventually carried the asset about 660% higher.
History rarely repeats in exactly the same form, and this signal cannot identify the final low. It does suggest that a meaningful part of the decline may already be behind the market. The long term balance between potential reward and risk is becoming more attractive, even if the short term trend still needs time to turn.
04
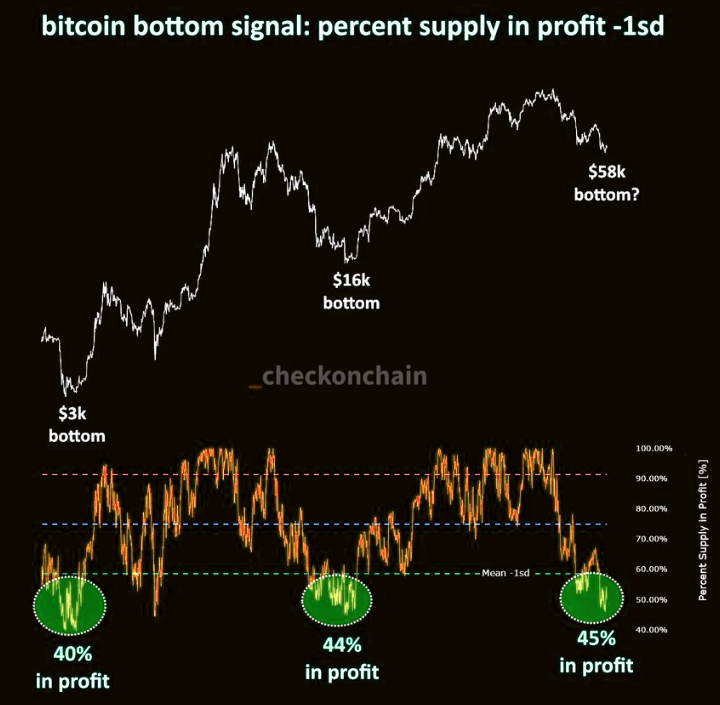
Only 45% of Circulating Bitcoin Remains in Profit
Around 45% of all Bitcoin in circulation - the share of coins that last moved at a price below today’s market price - is currently considered to be in profit.
Similar readings appeared near major market lows, with about 40% of circulating Bitcoin in profit around $3,000 and 44% near $16,000. The current level may suggest that losses have spread widely across the market and selling pressure is moving closer to exhaustion. It does not, however, confirm that the final bottom is already in place.
05
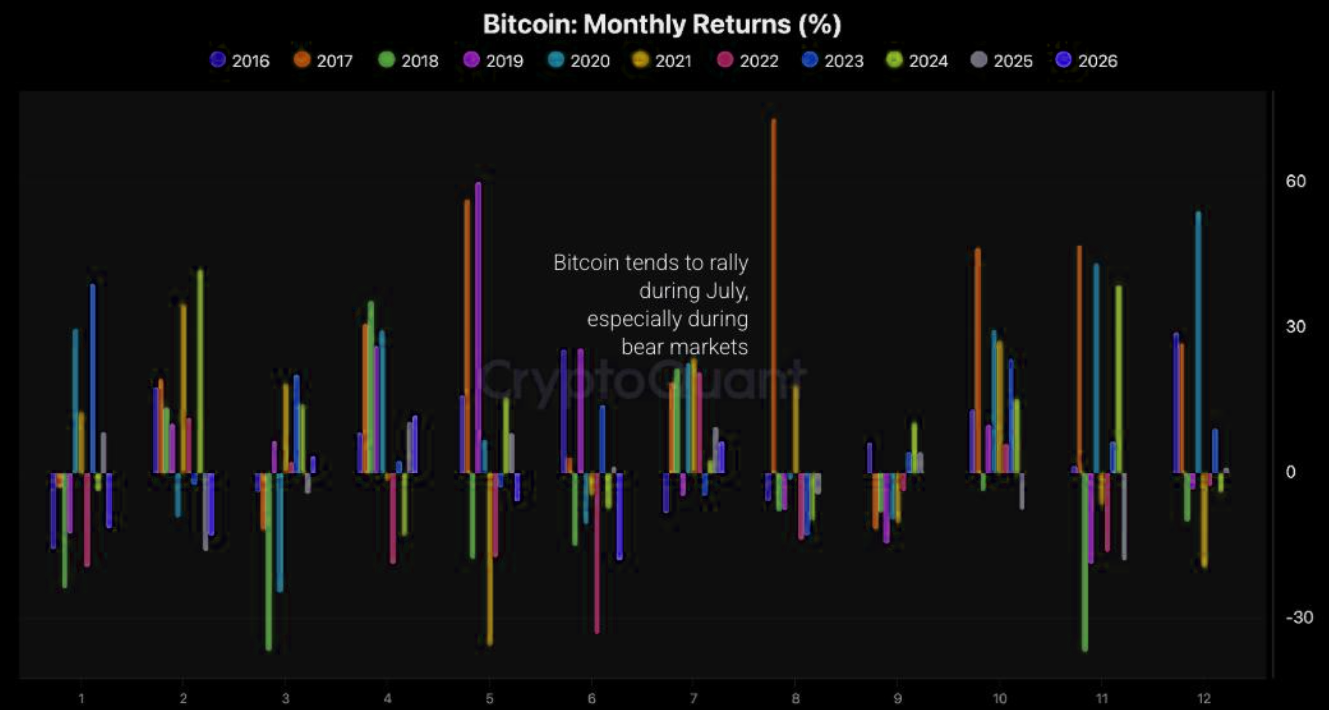
July Brings a Seasonal Tailwind
July has often offered Bitcoin a period of relief, including during broader bear markets. The asset gained about 20% in July 2018 and 17% in July 2022 despite a weak market backdrop. These episodes show how deeply oversold conditions can produce a strong rebound before the wider trend fully recovers
06
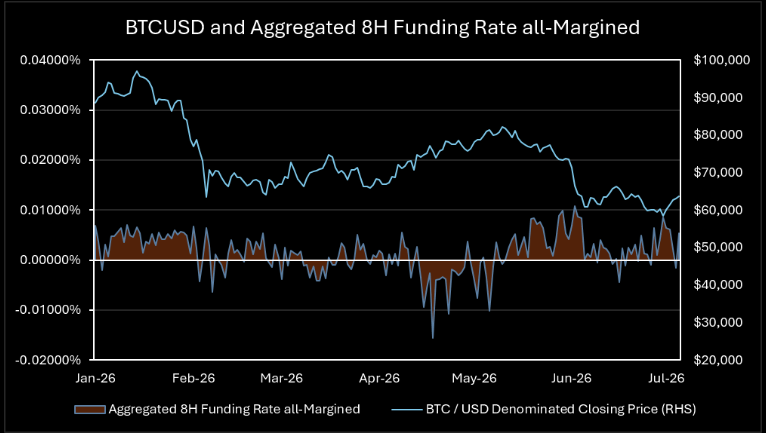
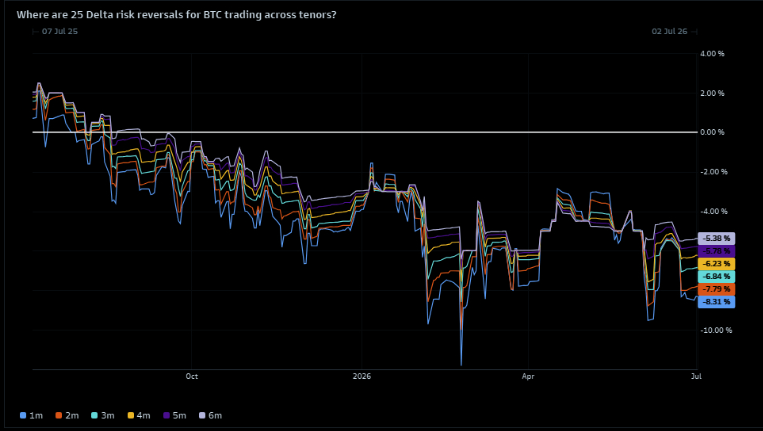
Derivatives Keep Their Guard Up
Funding rates briefly rose as Bitcoin approached its June 30 and July 1 lows, then moved back toward neutral as spot recovered. Leverage appears contained, while traders show little appetite for large directional bets. The rebound has attracted attention, but not yet the kind of speculation that usually marks an overheated market.
Options remain more cautious. Risk reversals are still tilted toward puts across maturities, pointing to continued demand for downside protection. Spot has recovered, but professional investors do not appear ready to lower their guard.
07
This Bear Market Has Been Milder
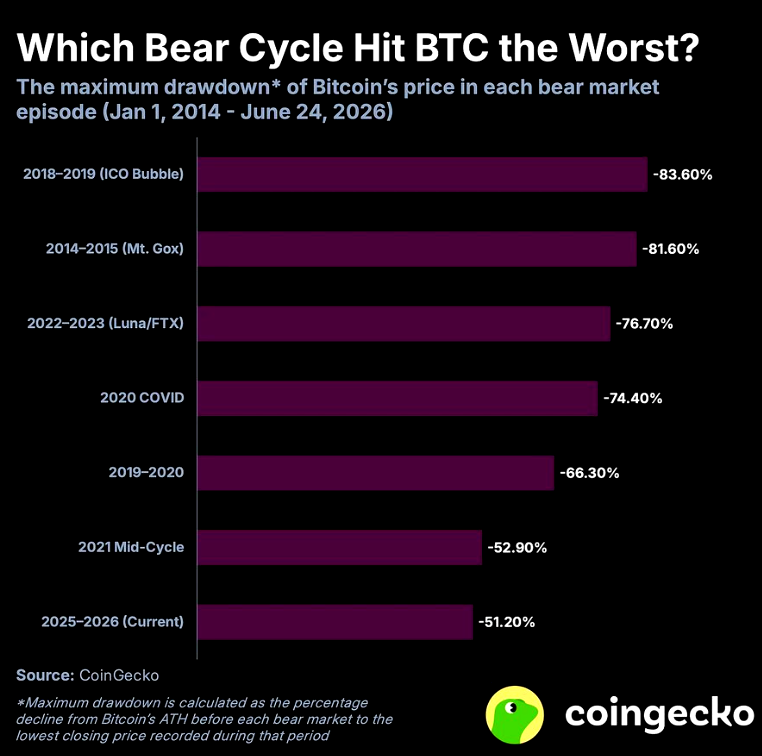
Bitcoin is about 51.2% below its all time high of $124,773. The decline is substantial, but so far it remains milder than the three major bear markets of the past, when losses ranged from 76.7% to 83.6%.
The market may be showing greater structural resilience as institutional participation grows. It may also mean that the full adjustment has not yet run its course. History offers a range of outcomes, not a fixed destination, so price structure remains the more useful guide.
08
Bitcoin Looks Deeply Discounted to Gold
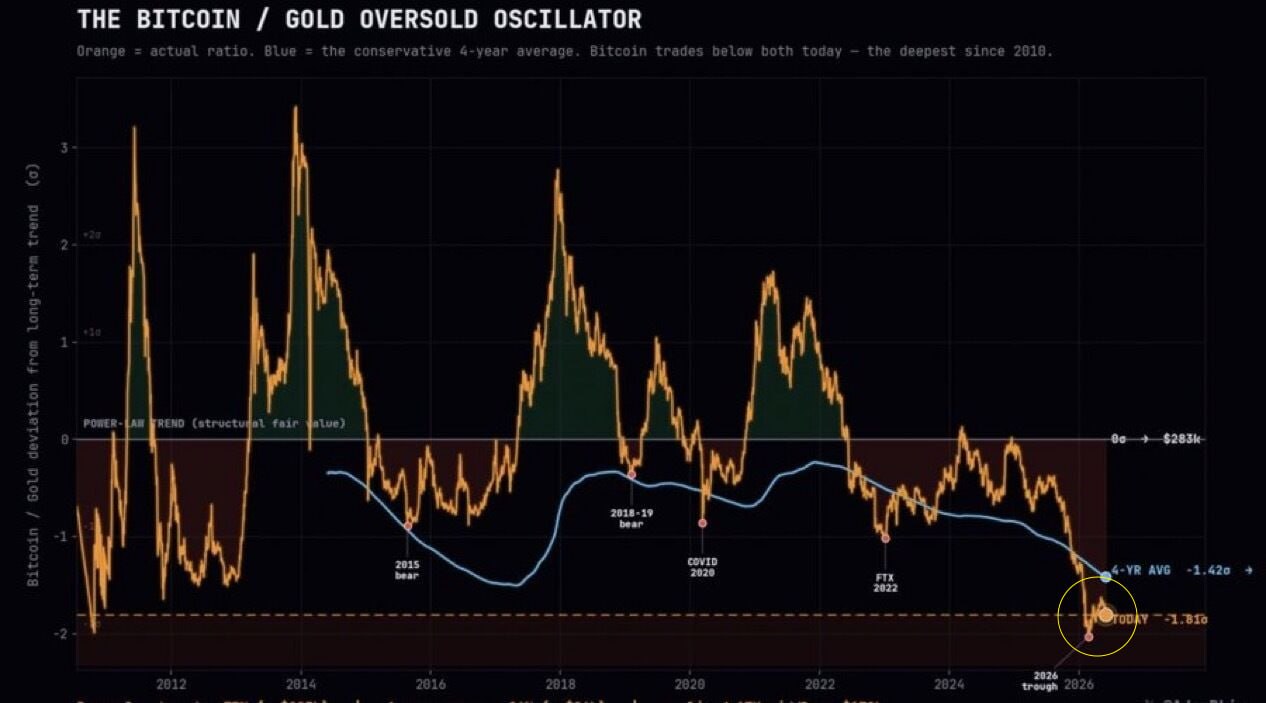
The correction looks even deeper when Bitcoin is measured against gold. The BTC to gold ratio has fallen to its lowest area since 2018 and now sits below its conservative four year trend. Similar periods of weakness relative to gold have appeared ahead of previous Bitcoin recovery cycles
09
Our Roadmap for the Week Ahead
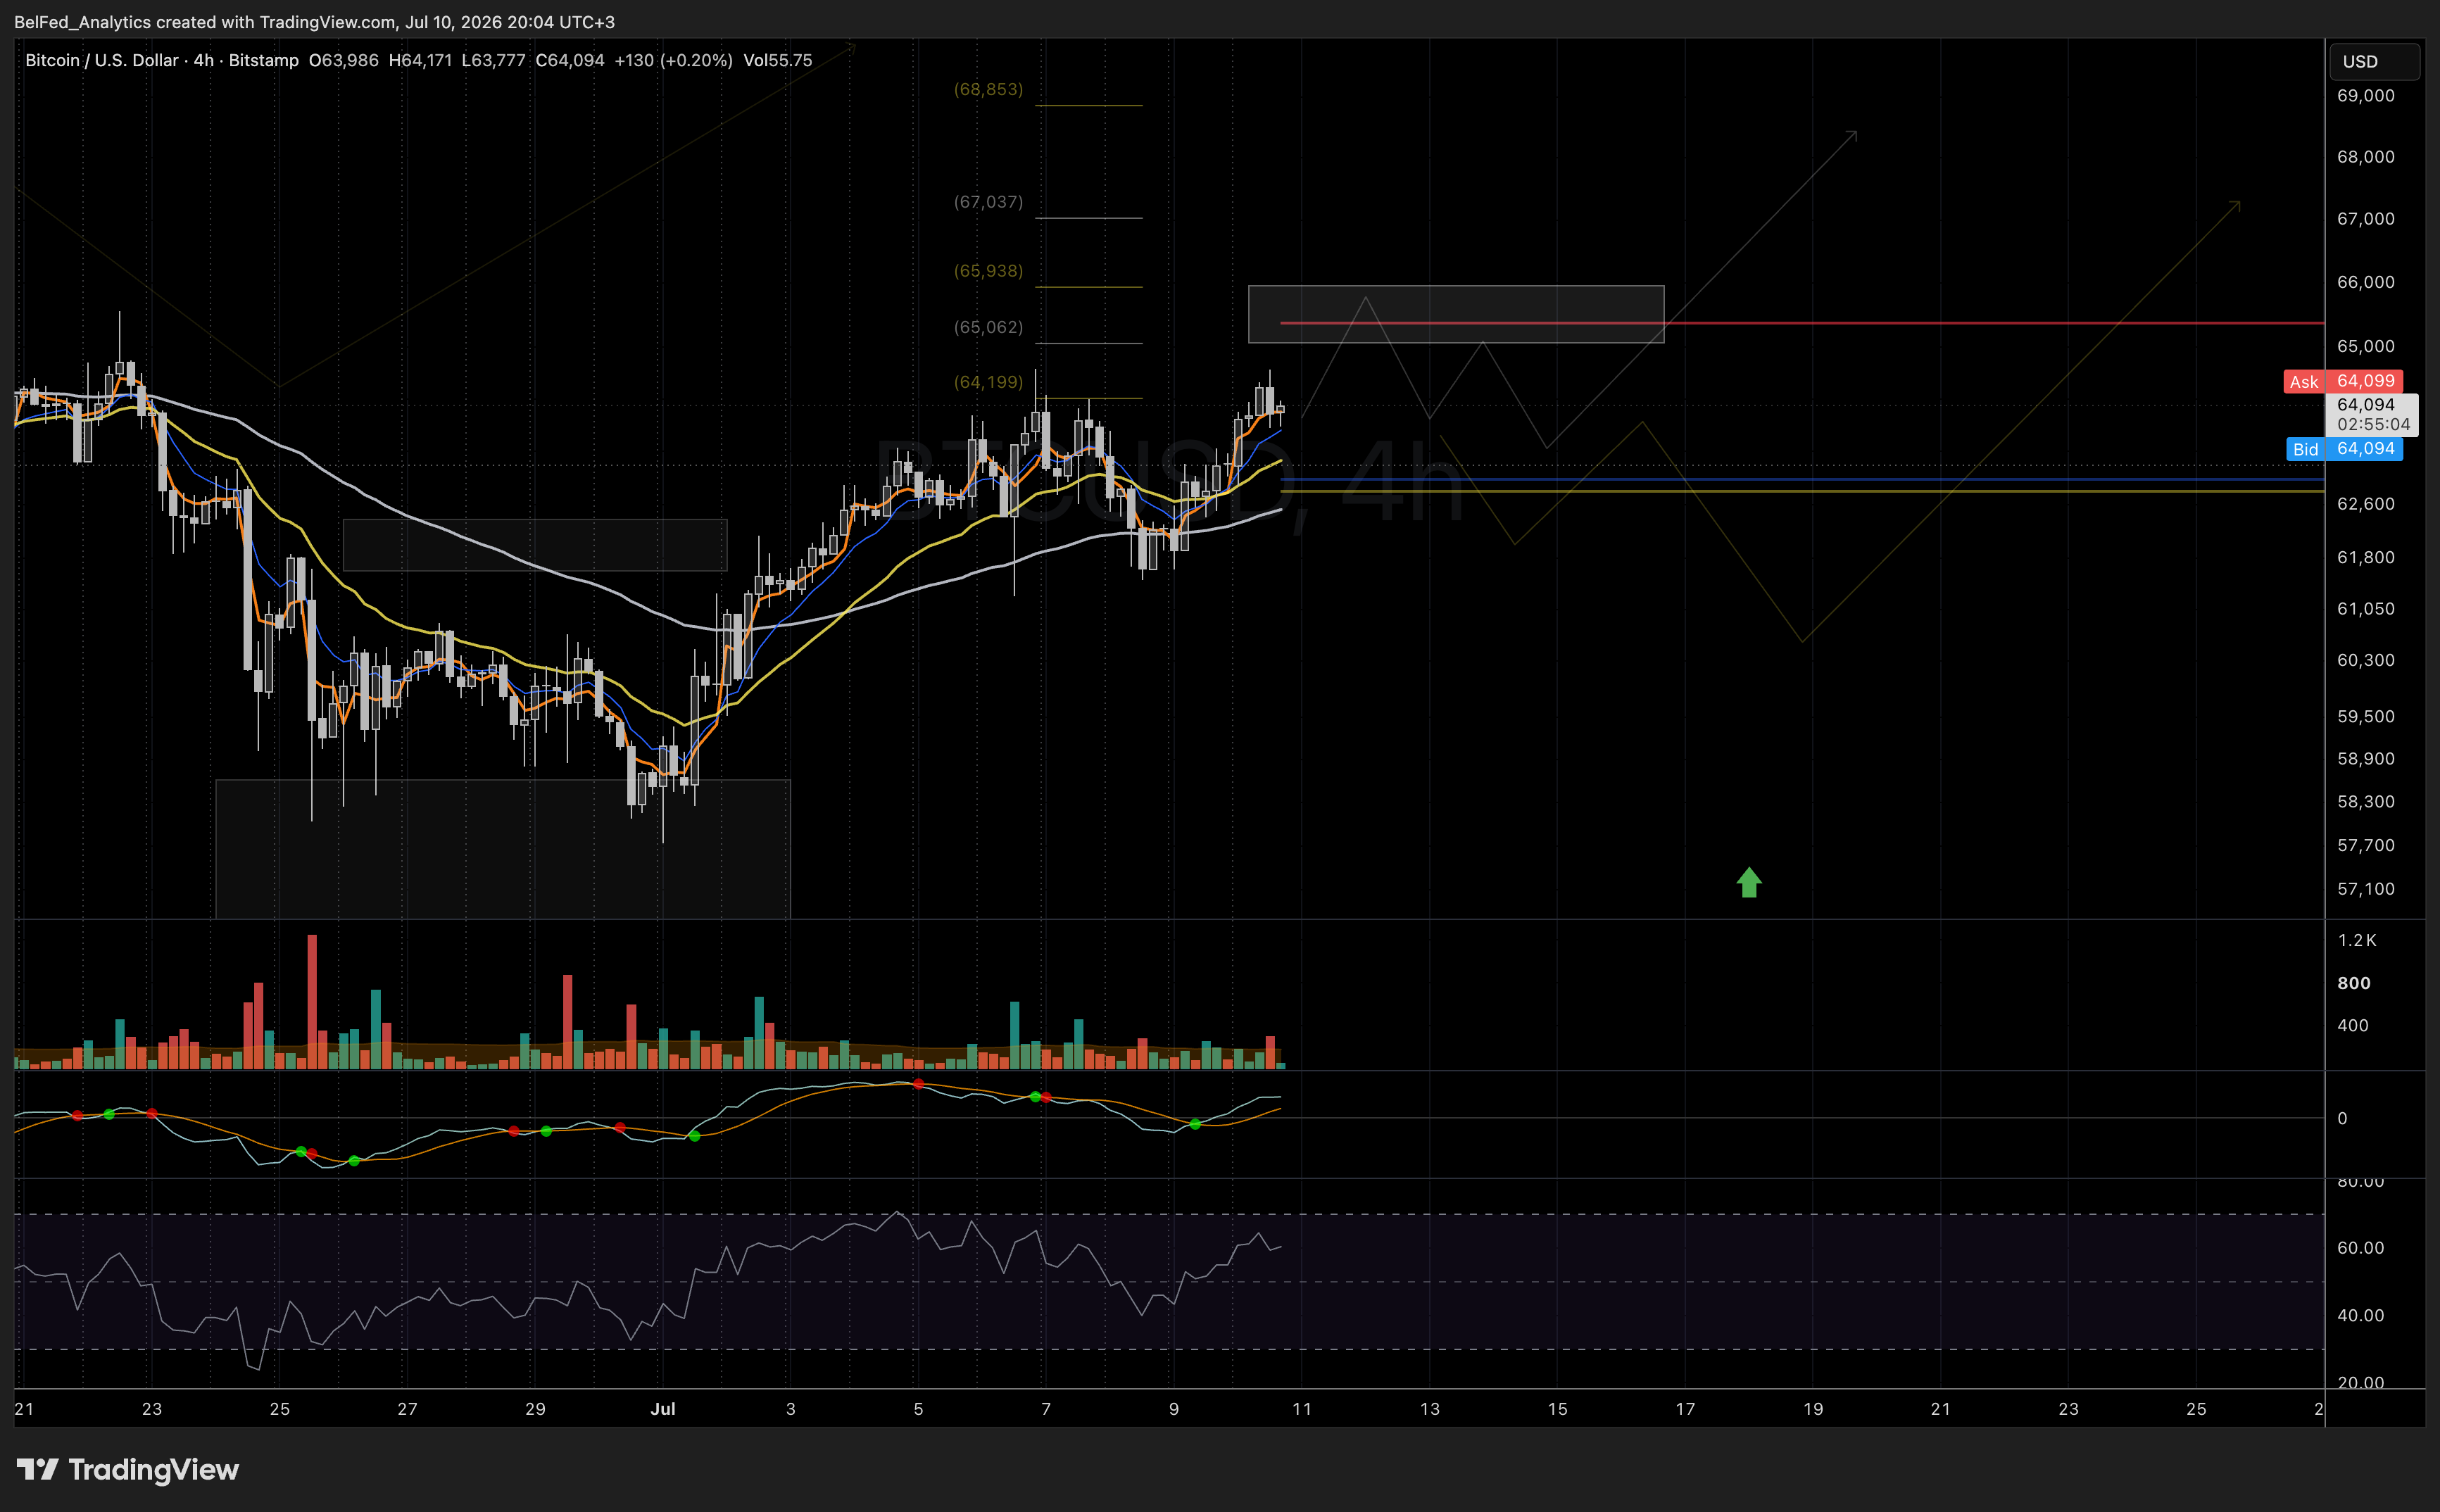
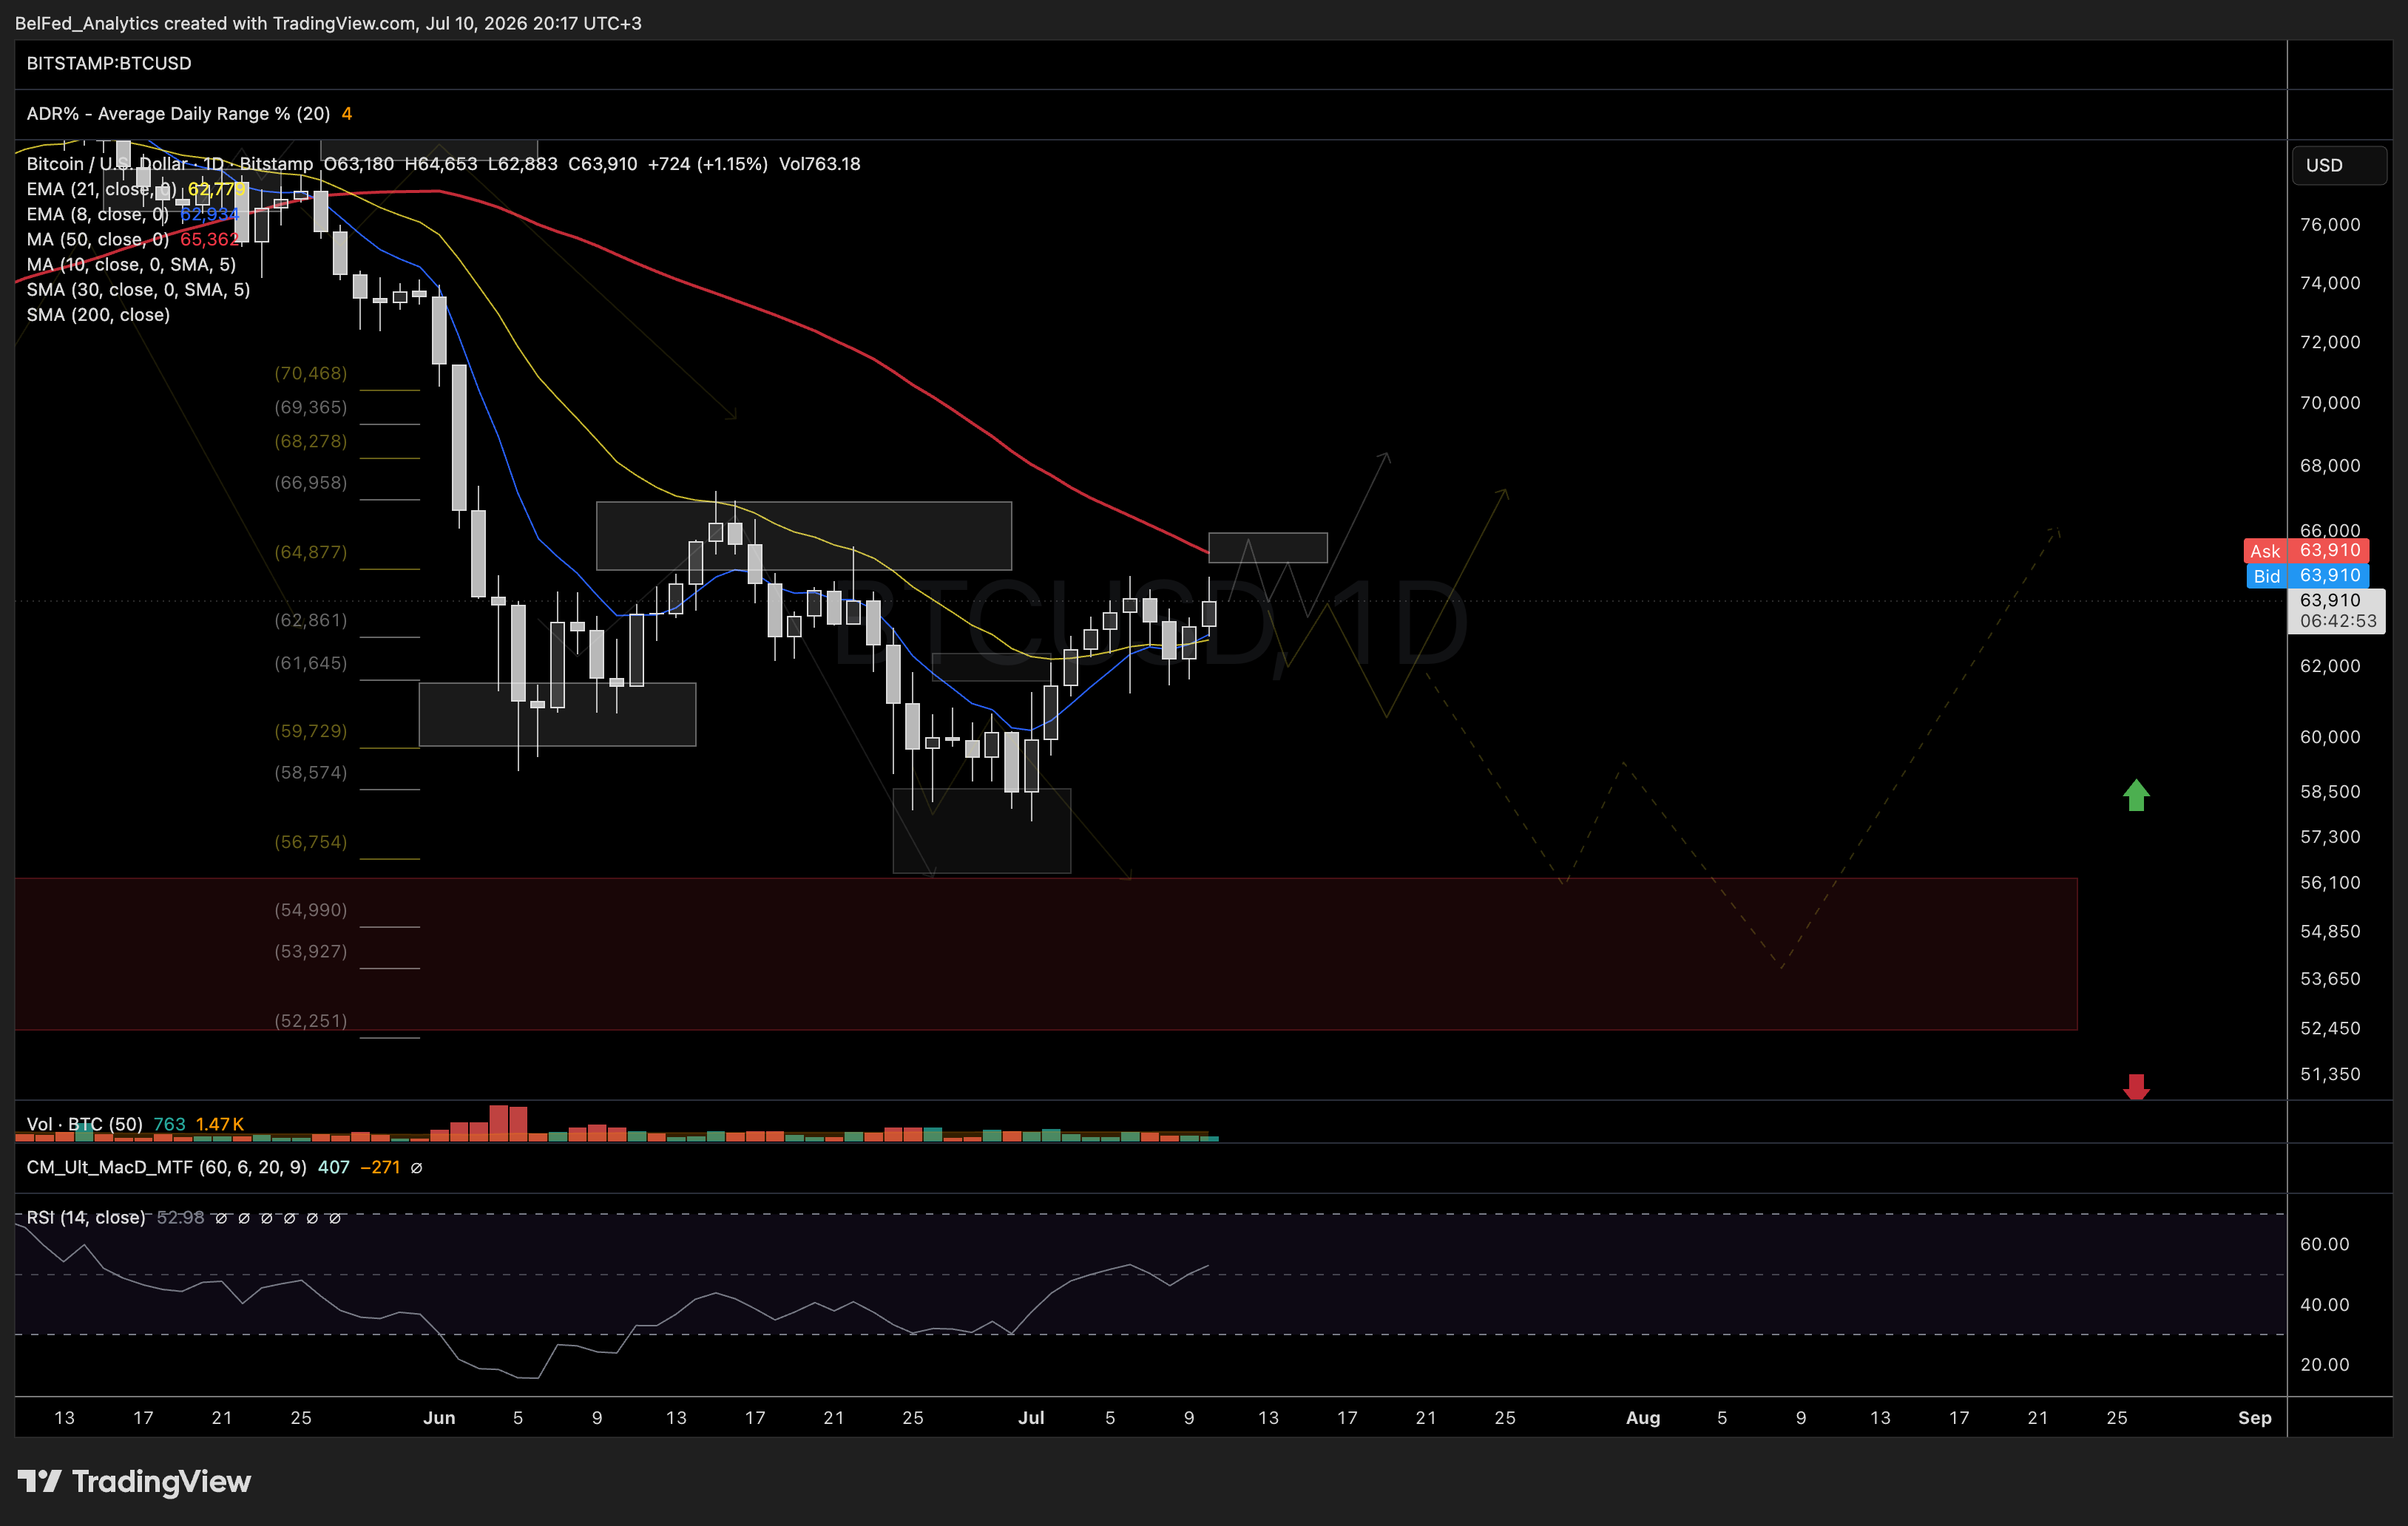
The evidence points to a market trying to build a bottom, although the process may not be complete. While Bitcoin remains below $65,000 to $66,000, consolidation remains our base case. A clear three wave pullback toward $63,000, or even $60,000, would be constructive and could form a higher low.
If Bitcoin fails to reclaim its 50 day moving average and $66,000 in the coming weeks, the odds may shift toward another decline, first to the July lows and potentially into support in the low $50,000s. A move above $66,000, supported by stronger ETF flows, would instead favor a broader recovery.
We will follow the structure closely and keep you updated as the market reveals its next move. Thank you for reading, and have a great weekend.
We've already mapped entries on the tickers in this report.
Levels, stops, and targets live inside the members area and Telegram, pushed the moment a setup triggers. Start a 14-day trial and get access before we open the first position in this theme. No card required.