
01
AI Left the Stock Market
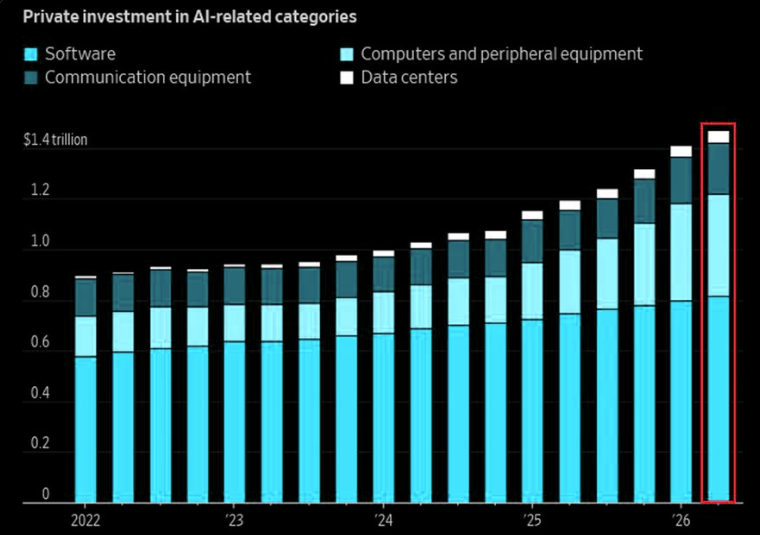
AI is no longer just a stock market story. It has become a line in the national accounts. Private investment in AI related categories reached a record 1.5 trillion dollars annualized in Q2 2026, roughly 300 billion more than a year earlier .
The chart shows where the money goes: software is the widest block, then computers and peripherals, communication equipment and data centres. Notice the shape. Until 2023 the bars barely move, and then they climb almost vertically. That is not a normal investment cycle, that is a build out.
By most estimates this single category now delivers a quarter to a third of all US growth. Which raises the awkward question: what does the economy look like without it?
02
Two Economies, One Country
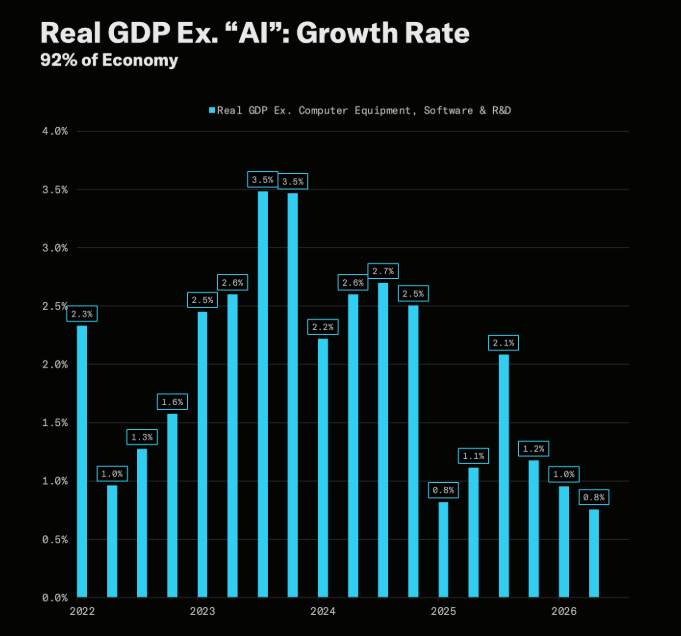
Here is the answer. Take out computer equipment, software and research spending, and what is left is about 92% of the economy. That part is growing at roughly 1%.
The chart makes the story visible. In 2023 these bars reached 3.5%, in 2024 they were still around 2.5%, and through 2025 and 2026 they slide to 1.2%, 1.0% and 0.8%. In other words, while the AI numbers were breaking records, the ordinary economy was quietly slowing down.
So there are really two Americas at the moment: the AI economy, which is booming, and everything else, which is much less exciting. This does not mean the boom is fake. It means the boom carries an enormous amount of weight, and that is the theme of the whole report.
03
Companies That Act Like Governments
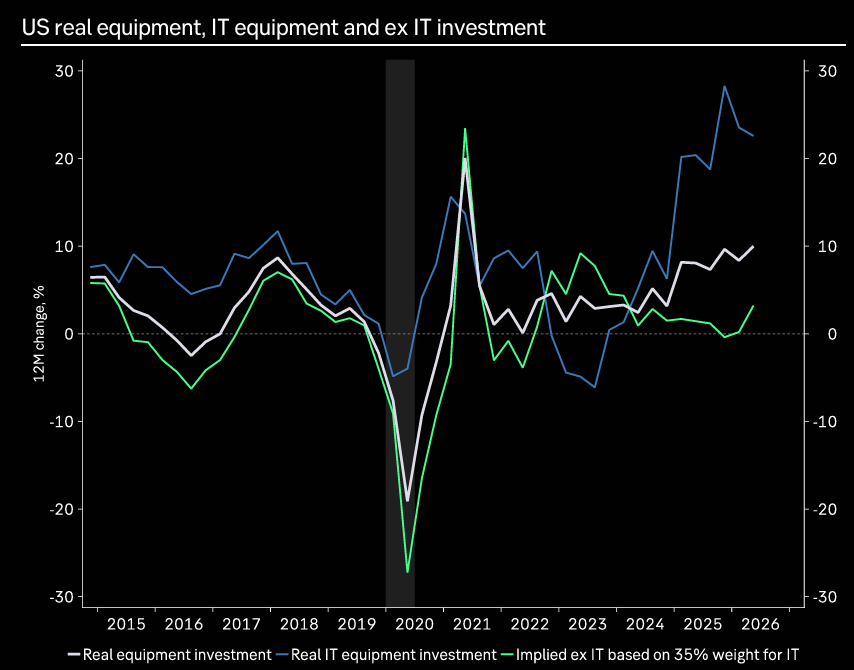
Zoom into business investment and the concentration becomes even clearer. The blue line, IT equipment, jumps to almost 30% annual growth in 2025 and 2026. The white line, all equipment investment, rises far more modestly, and the green line, everything except IT, hovers around zero.
Without IT, American companies have effectively stopped expanding their capital base. One category is doing the pulling, the rest is standing still.
This is the strange part of the AI era. Investors are used to seeing Nvidia, Microsoft, Meta and Google as companies. Increasingly they behave like a government stimulus programme, financing national growth through their budgets. With one difference: they are spending shareholders' money, and shareholders can change their mind.
04
The Same Curve, Twice
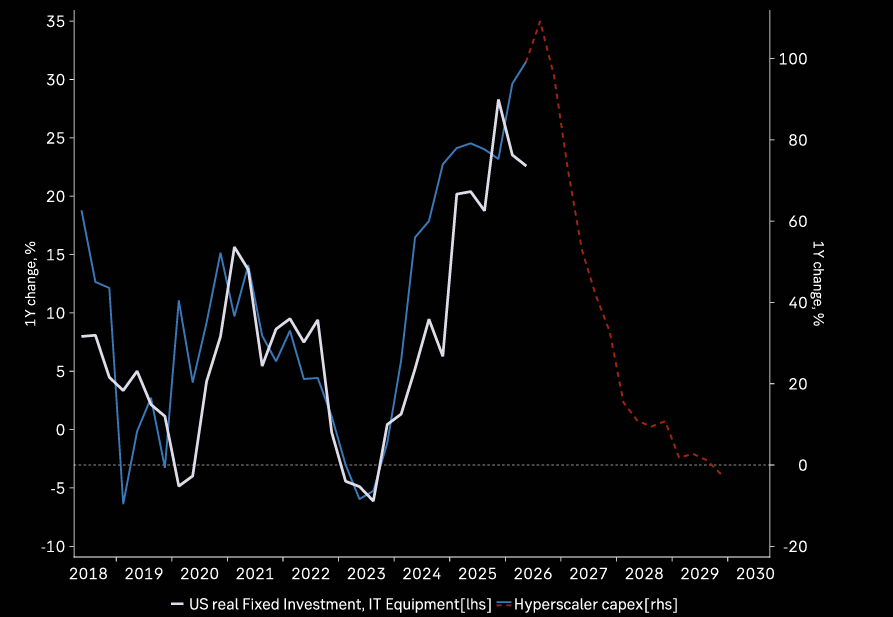
This chart puts the two forces side by side. The white line is real US investment in IT equipment, the red dashed line is expected capex of the largest cloud companies. Until 2026 they move together almost perfectly, which tells you who actually drives national investment numbers.
Now look at the right side. Consensus itself assumes the growth rate of that capex falls from above 100% in 2026 towards zero by 2029. Note carefully: that is a slowdown in growth, not a collapse in spending. Budgets stay huge, they simply stop doubling.
That distinction matters for the whole economy. GDP responds to change, not to level. If capex merely stops accelerating, the investment engine can go from adding to growth to adding almost nothing, without a single company cancelling a project.
05
Three Percent of America
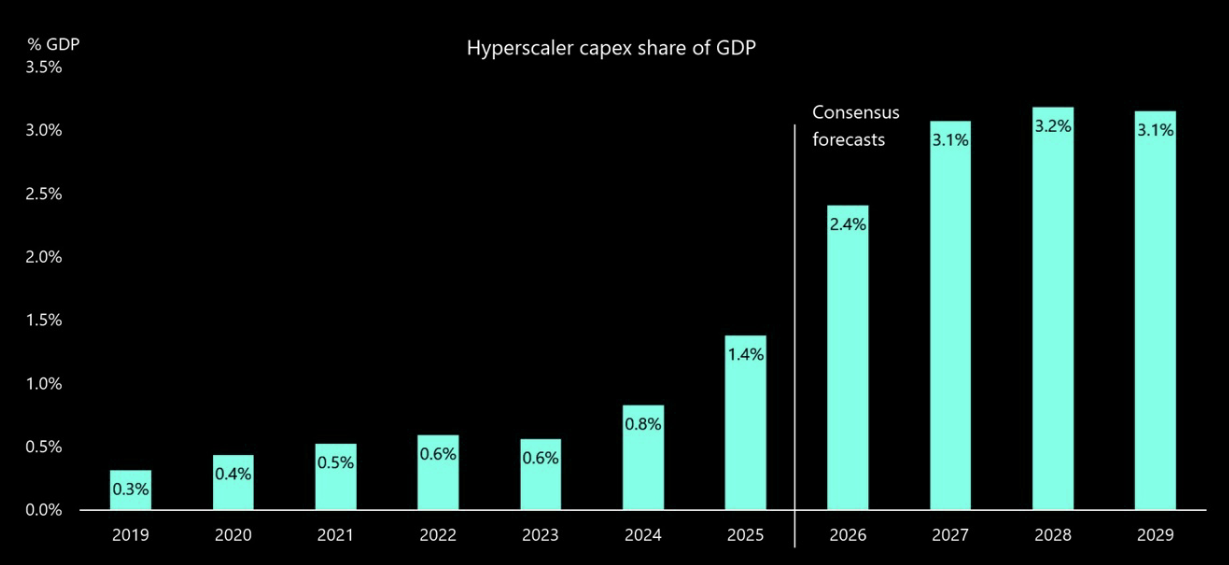
Cloud giant capex was 0.3% of US GDP in 2019 and 1.4% in 2025. Consensus expects 2.4% this year and around 3% every year through 2029.
Three percent of GDP is a lot of GPUs. It is also a lot of national growth resting on a small group of boards deciding that today's enormous AI budgets should become tomorrow's even bigger AI budgets. For reference, that is roughly the size of an entire mid sized European economy, generated by a handful of balance sheets .
And the forecast is not a possibility, it is the base case everyone already assumes. Which is exactly why the risk is not that spending falls, but that it merely disappoints. Have we not seen this movie before?
06
Bigger Than the Year 2000
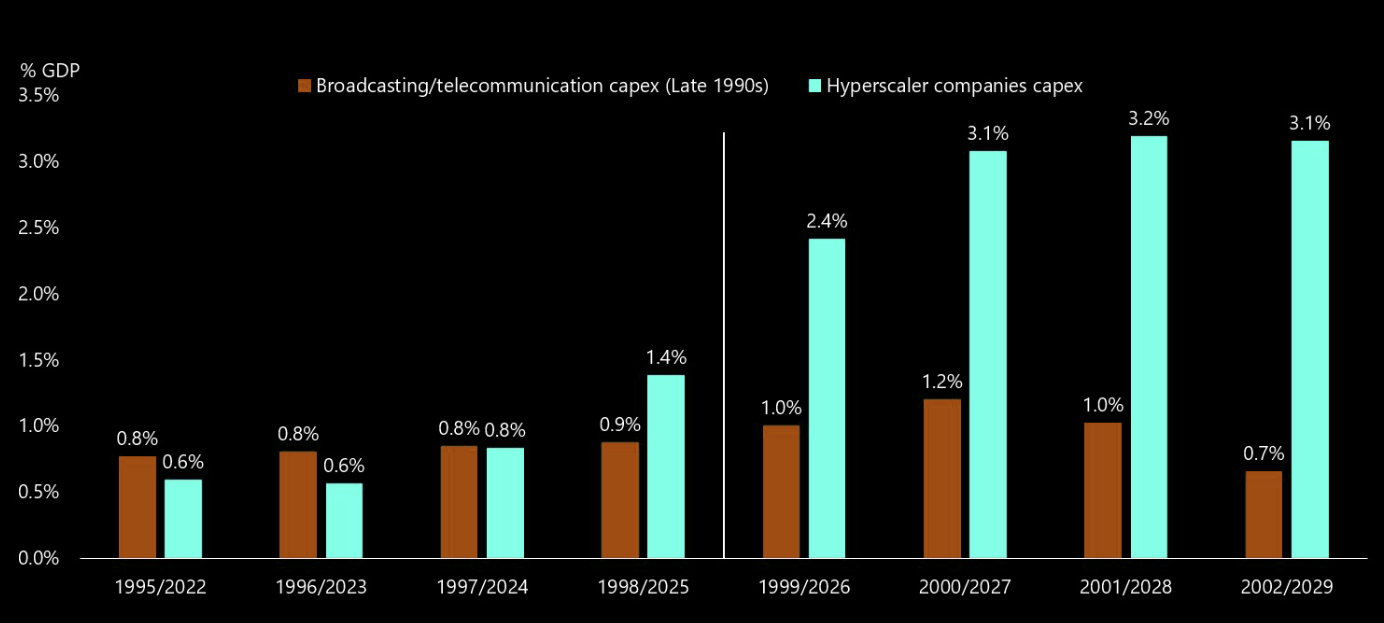
We have. At the peak of the late 1990s internet build out, telecom and broadcasting capex never went far above 1% of GDP. Today's AI build out is projected at two to three times that share.
The chart lines the years up directly: 1995 against 2022, 1999 against 2026, 2002 against 2029. In the first years the brown bars, telecom, are actually bigger. Then the light bars, cloud giants, take off and leave them behind.
The point is not that history must repeat. It is that we are already past the previous record, and the previous record ended with a lot of expensive infrastructure waiting for demand that arrived years later than promised.
07
How the Movie Ended
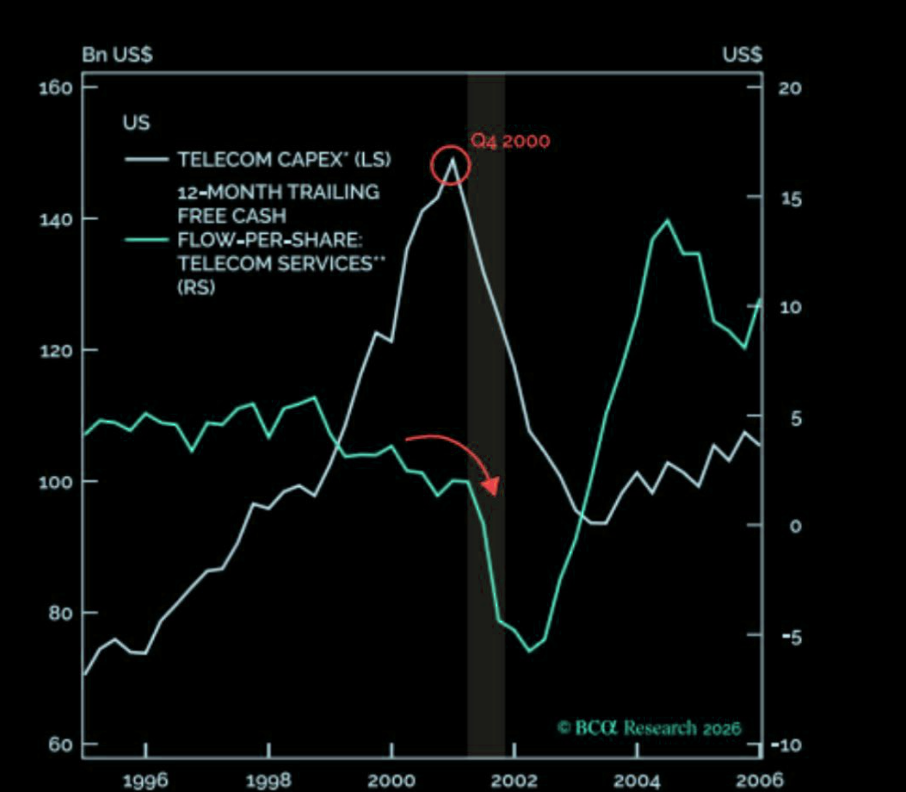
The right-hand chart illustrates the final stage of the previous cycle. Telecom capex peaked in Q4 2000 (light line), but free cash flow (FCF, green line) began to deteriorate long before that. Ultimately, both metrics collapsed.
The key takeaway lies in the timeline of the crash. First, cash generation declines. Capex continues to rise for a period, driven by inertia and inflated expectations, and only then does a severe correction in investment budgets occur.
The internet revolution was real, but investments outpaced reality. Infrastructure was built at an excessive cost in anticipation of immediate monetization. The delayed payback timelines ultimately wiped out the capital of the network builders. This structural disconnect between a disruptive technology and inflated financial expectations is exactly where the primary risk of today's AI investments lies.
08
The Bill Comes First
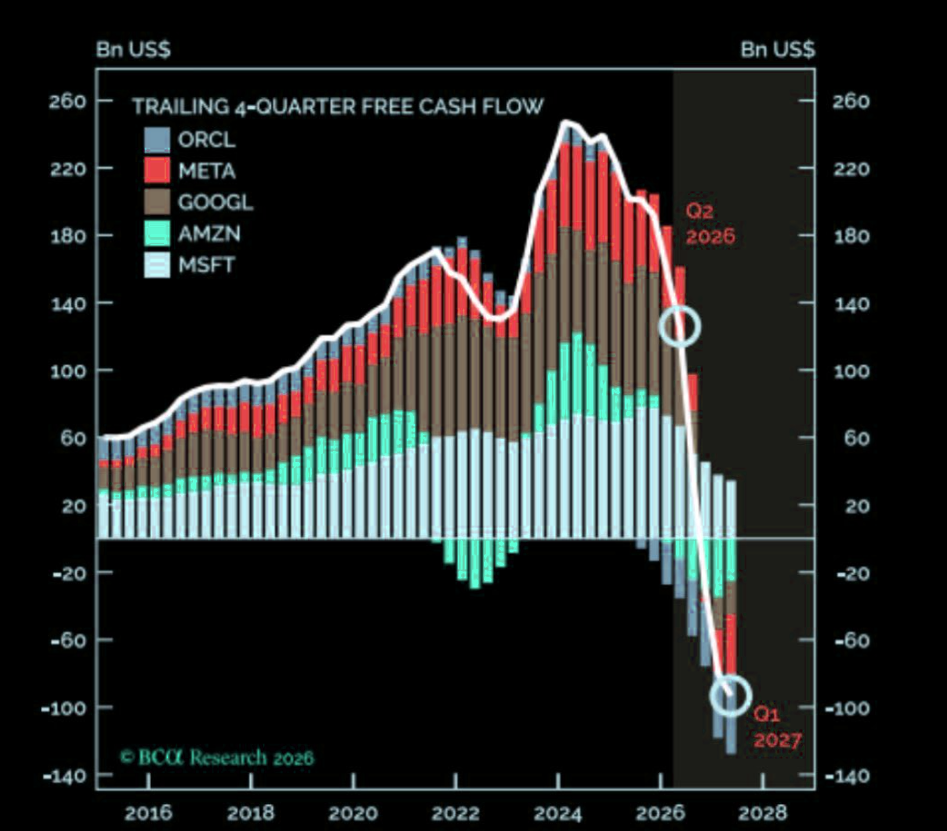
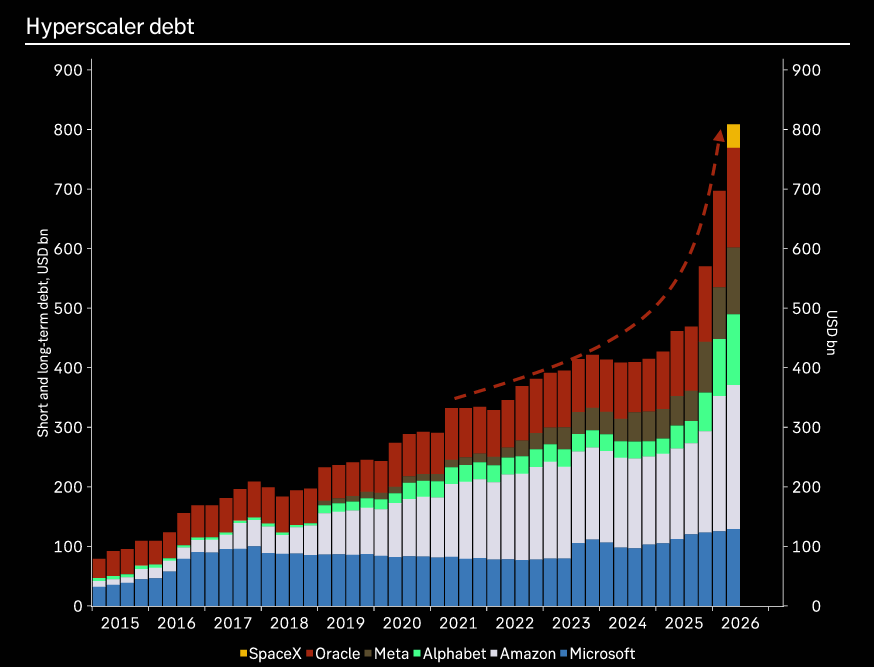
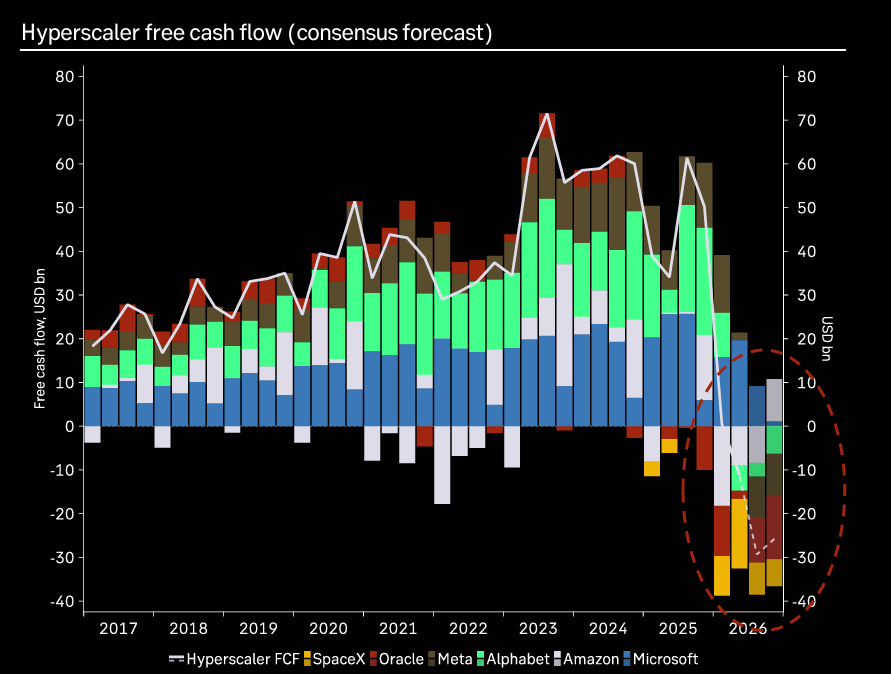
So where are we in that sequence? These two charts answer it. Combined debt of the largest AI spenders is rising almost vertically towards 800 billion dollars, and trailing free cash flow, after peaking around 250 billion in 2024, is expected to turn deeply negative by early 2027.
Put simply, the bill for the build out arrives before the revenue does. AI income is growing quickly, just not quickly enough to keep pace with the spending , and the funding gap is being closed with borrowed money .
Nothing here is contrarian anymore. Everyone has seen these charts, and so far the market does not mind. Maybe the market is right and the returns eventually justify everything. But for the economy the conclusion is simpler: a slowdown in this spending now matters far beyond the tech sector.
09
Spending Without Income
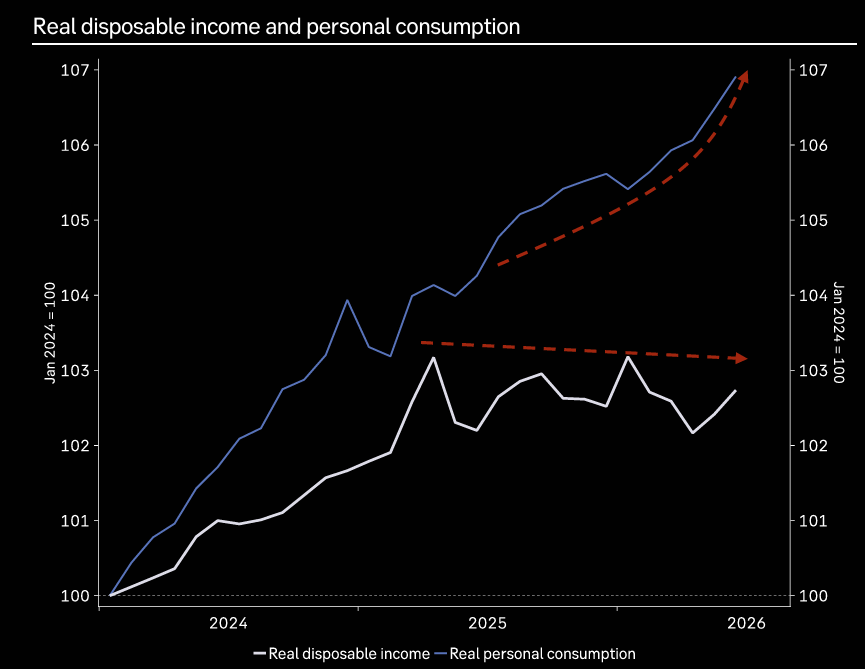
Now to the second half of the economy, the consumer. The first chart shows the gap: since late 2024 real spending, the blue line, keeps climbing to 107, while real disposable income, the white line, flattens near 103. People are spending more without earning much more.
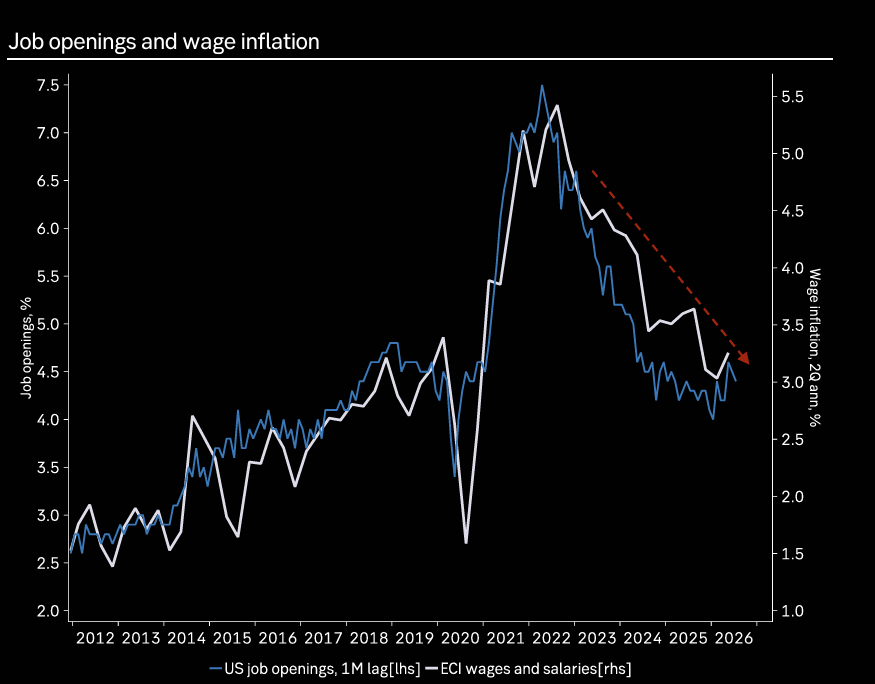
The second chart shows why that is not simply confidence. Job openings have fallen from 7.5% to about 4.5%, and wage growth keeps sliding with them. A labour market like this does not normally produce a spending boom.
So consumption is being financed by something other than the pay cheque. That something is the wealth effect from asset prices.
010
Feeling Rich
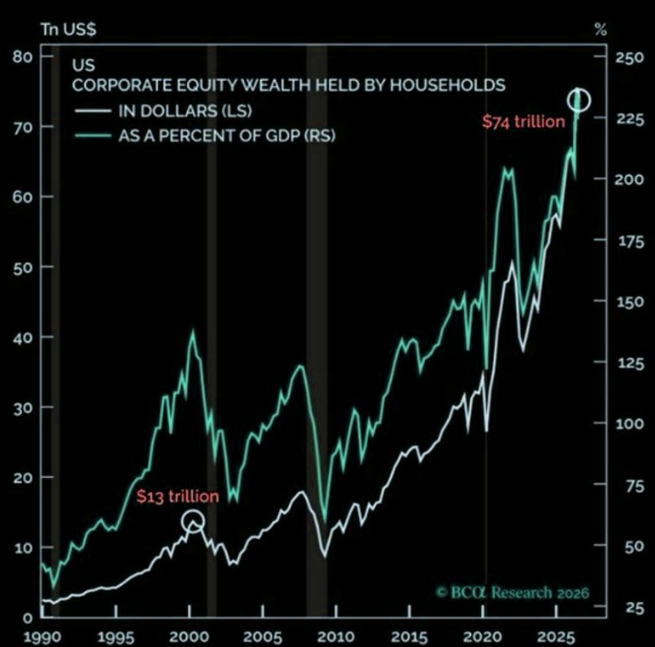
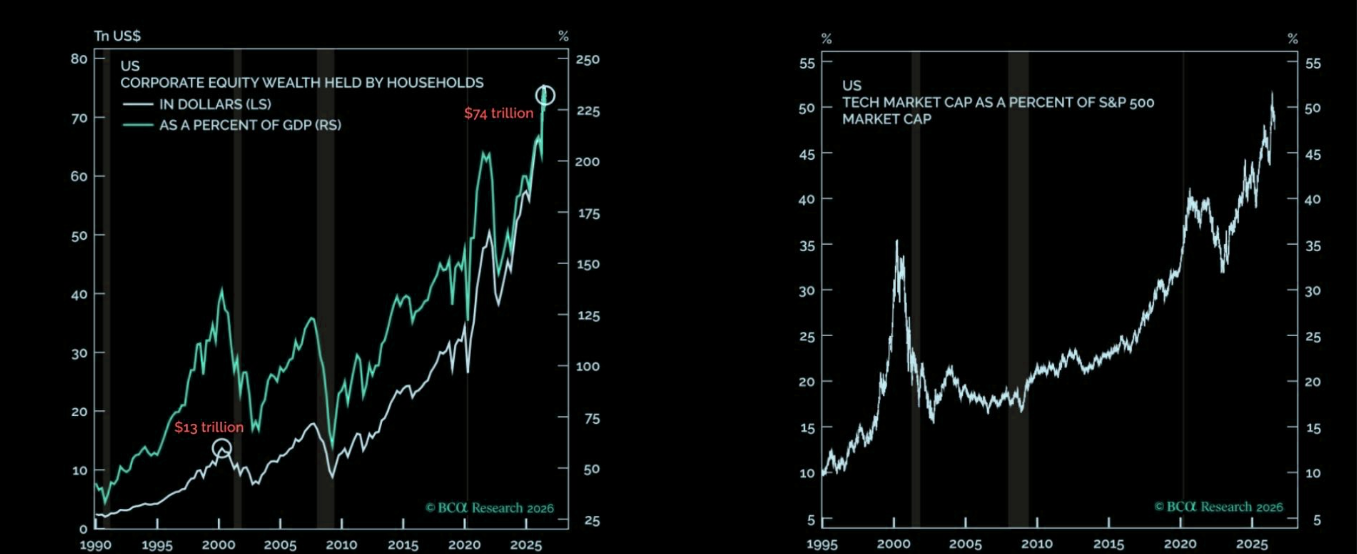
Here is the explanation. US households now hold a record 74 trillion dollars of equities, up roughly 48 trillion since 2020. As a share of GDP that stake is above 230%, higher than in 2000 and higher than in 2007.
The second panel adds the crucial detail: technology is now more than half of the entire S&P 500 by market value. So household wealth and the AI story have become nearly the same thing.
The mechanism is easy to follow. Stocks rise, people with portfolios feel richer, they spend more, and the economy looks stronger. Roughly 180 billion dollars a year of extra consumption is estimated to come from this channel alone . The uncomfortable part is that the same mechanism runs backwards just as smoothly.
011
The Circular Trade
Put the report together and you get a loop. AI spending lifts GDP. It lifts expected AI profits. AI shares rise. Rising shares lift household wealth. Wealth supports consumption. Consumption keeps the economy looking strong, and a strong economy makes all of the spending look sustainable.
Every step is real. The problem is that the loop has no independent brake, so it turns in whichever direction it is pushed. As BCA puts it, the wealth effect from a technology bust would be more severe than in 2000, because households own far more equity relative to the economy today.
That is the honest answer to our question. The AI trade is no longer only inside the stock market. The stock market is now inside the economy.
We've already mapped entries on the tickers in this report.
Levels, stops, and targets live inside the members area and Telegram, pushed the moment a setup triggers. Start a 14-day trial and get access before we open the first position in this theme. No card required.