
01
US 2-Year Yield Surges as Rate-Hike Fears Return
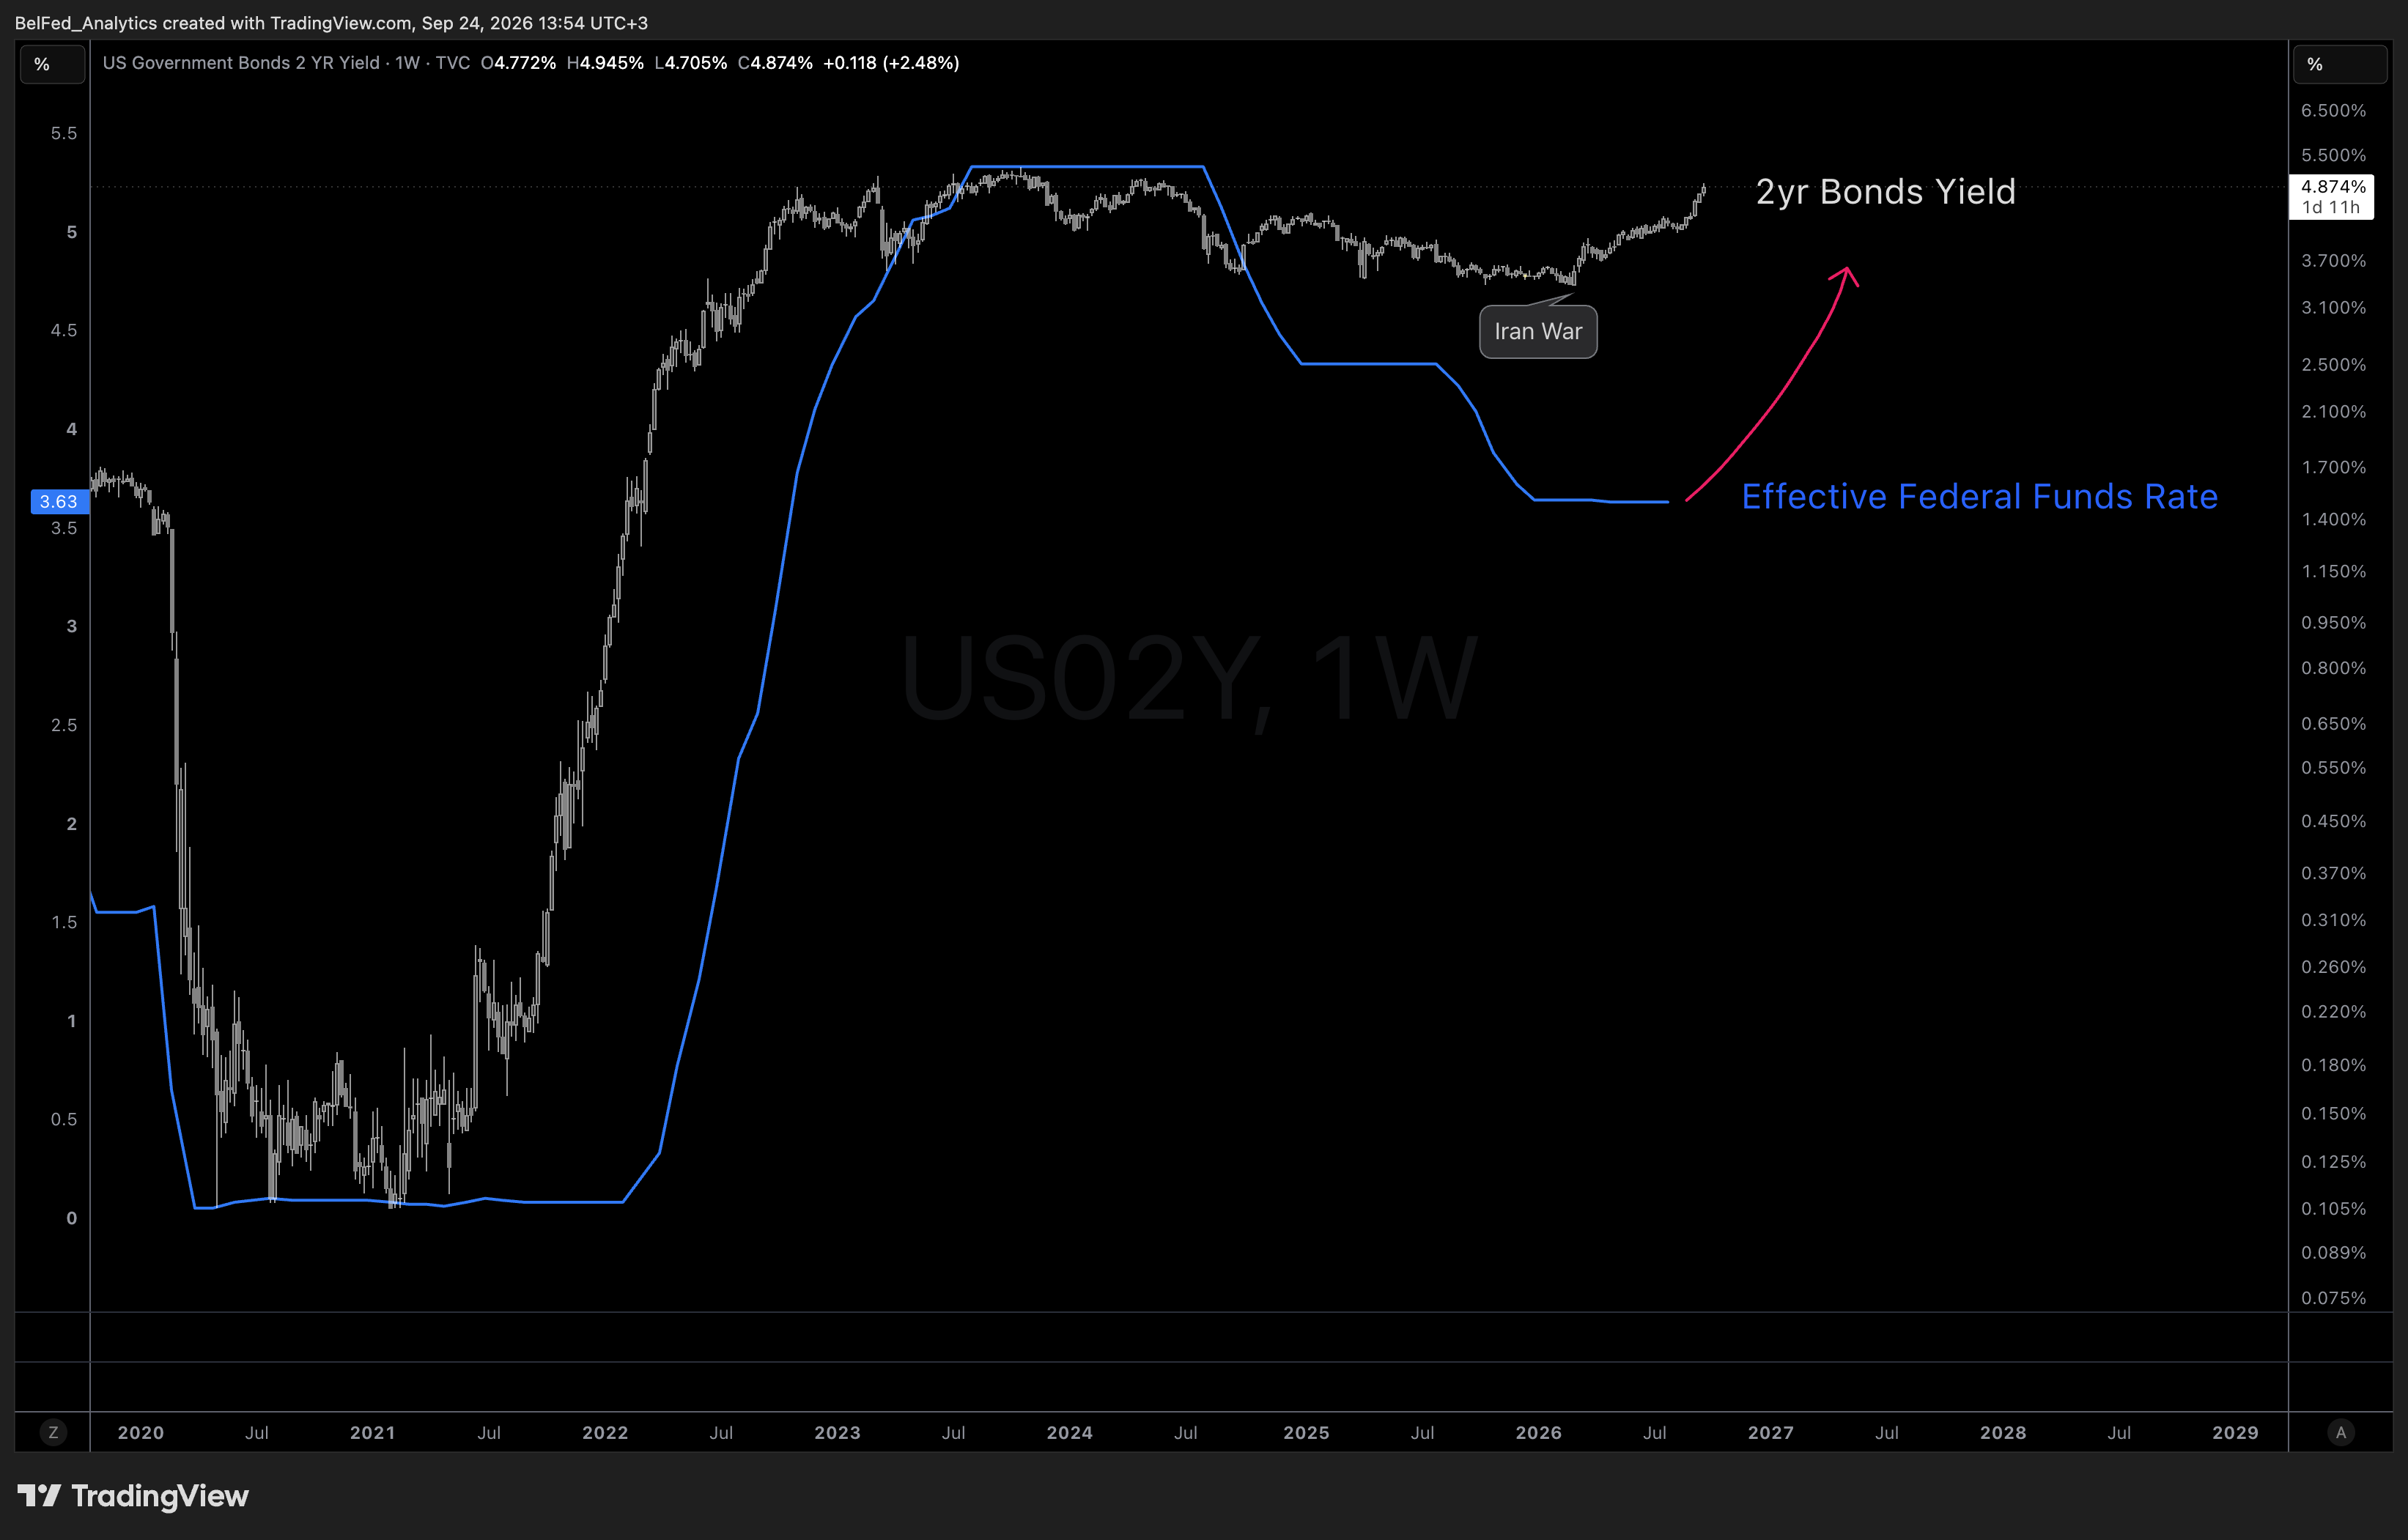
The US 2-year Treasury yield, the primary proxy for Fed policy expectations, has surged from 4.0% to 4.87%, decoupling from the effective policy rate at 3.63%. The speed of this repricing is significantly faster than the 2017–2018 tightening cycle.
Bond markets are pricing in potential rate hikes as headline inflation rebounds, driven by energy and commodities. Meanwhile, core inflation has remained stuck above the 2% target for roughly 68 consecutive months.
Historical analogs from the late 1990s and 2000s suggest that when rates break aggressively above their cycle range, the window of support for equity valuations closes rapidly.
02
Rebounding Inflation Builds Case for Renewed Fed Rate Hikes
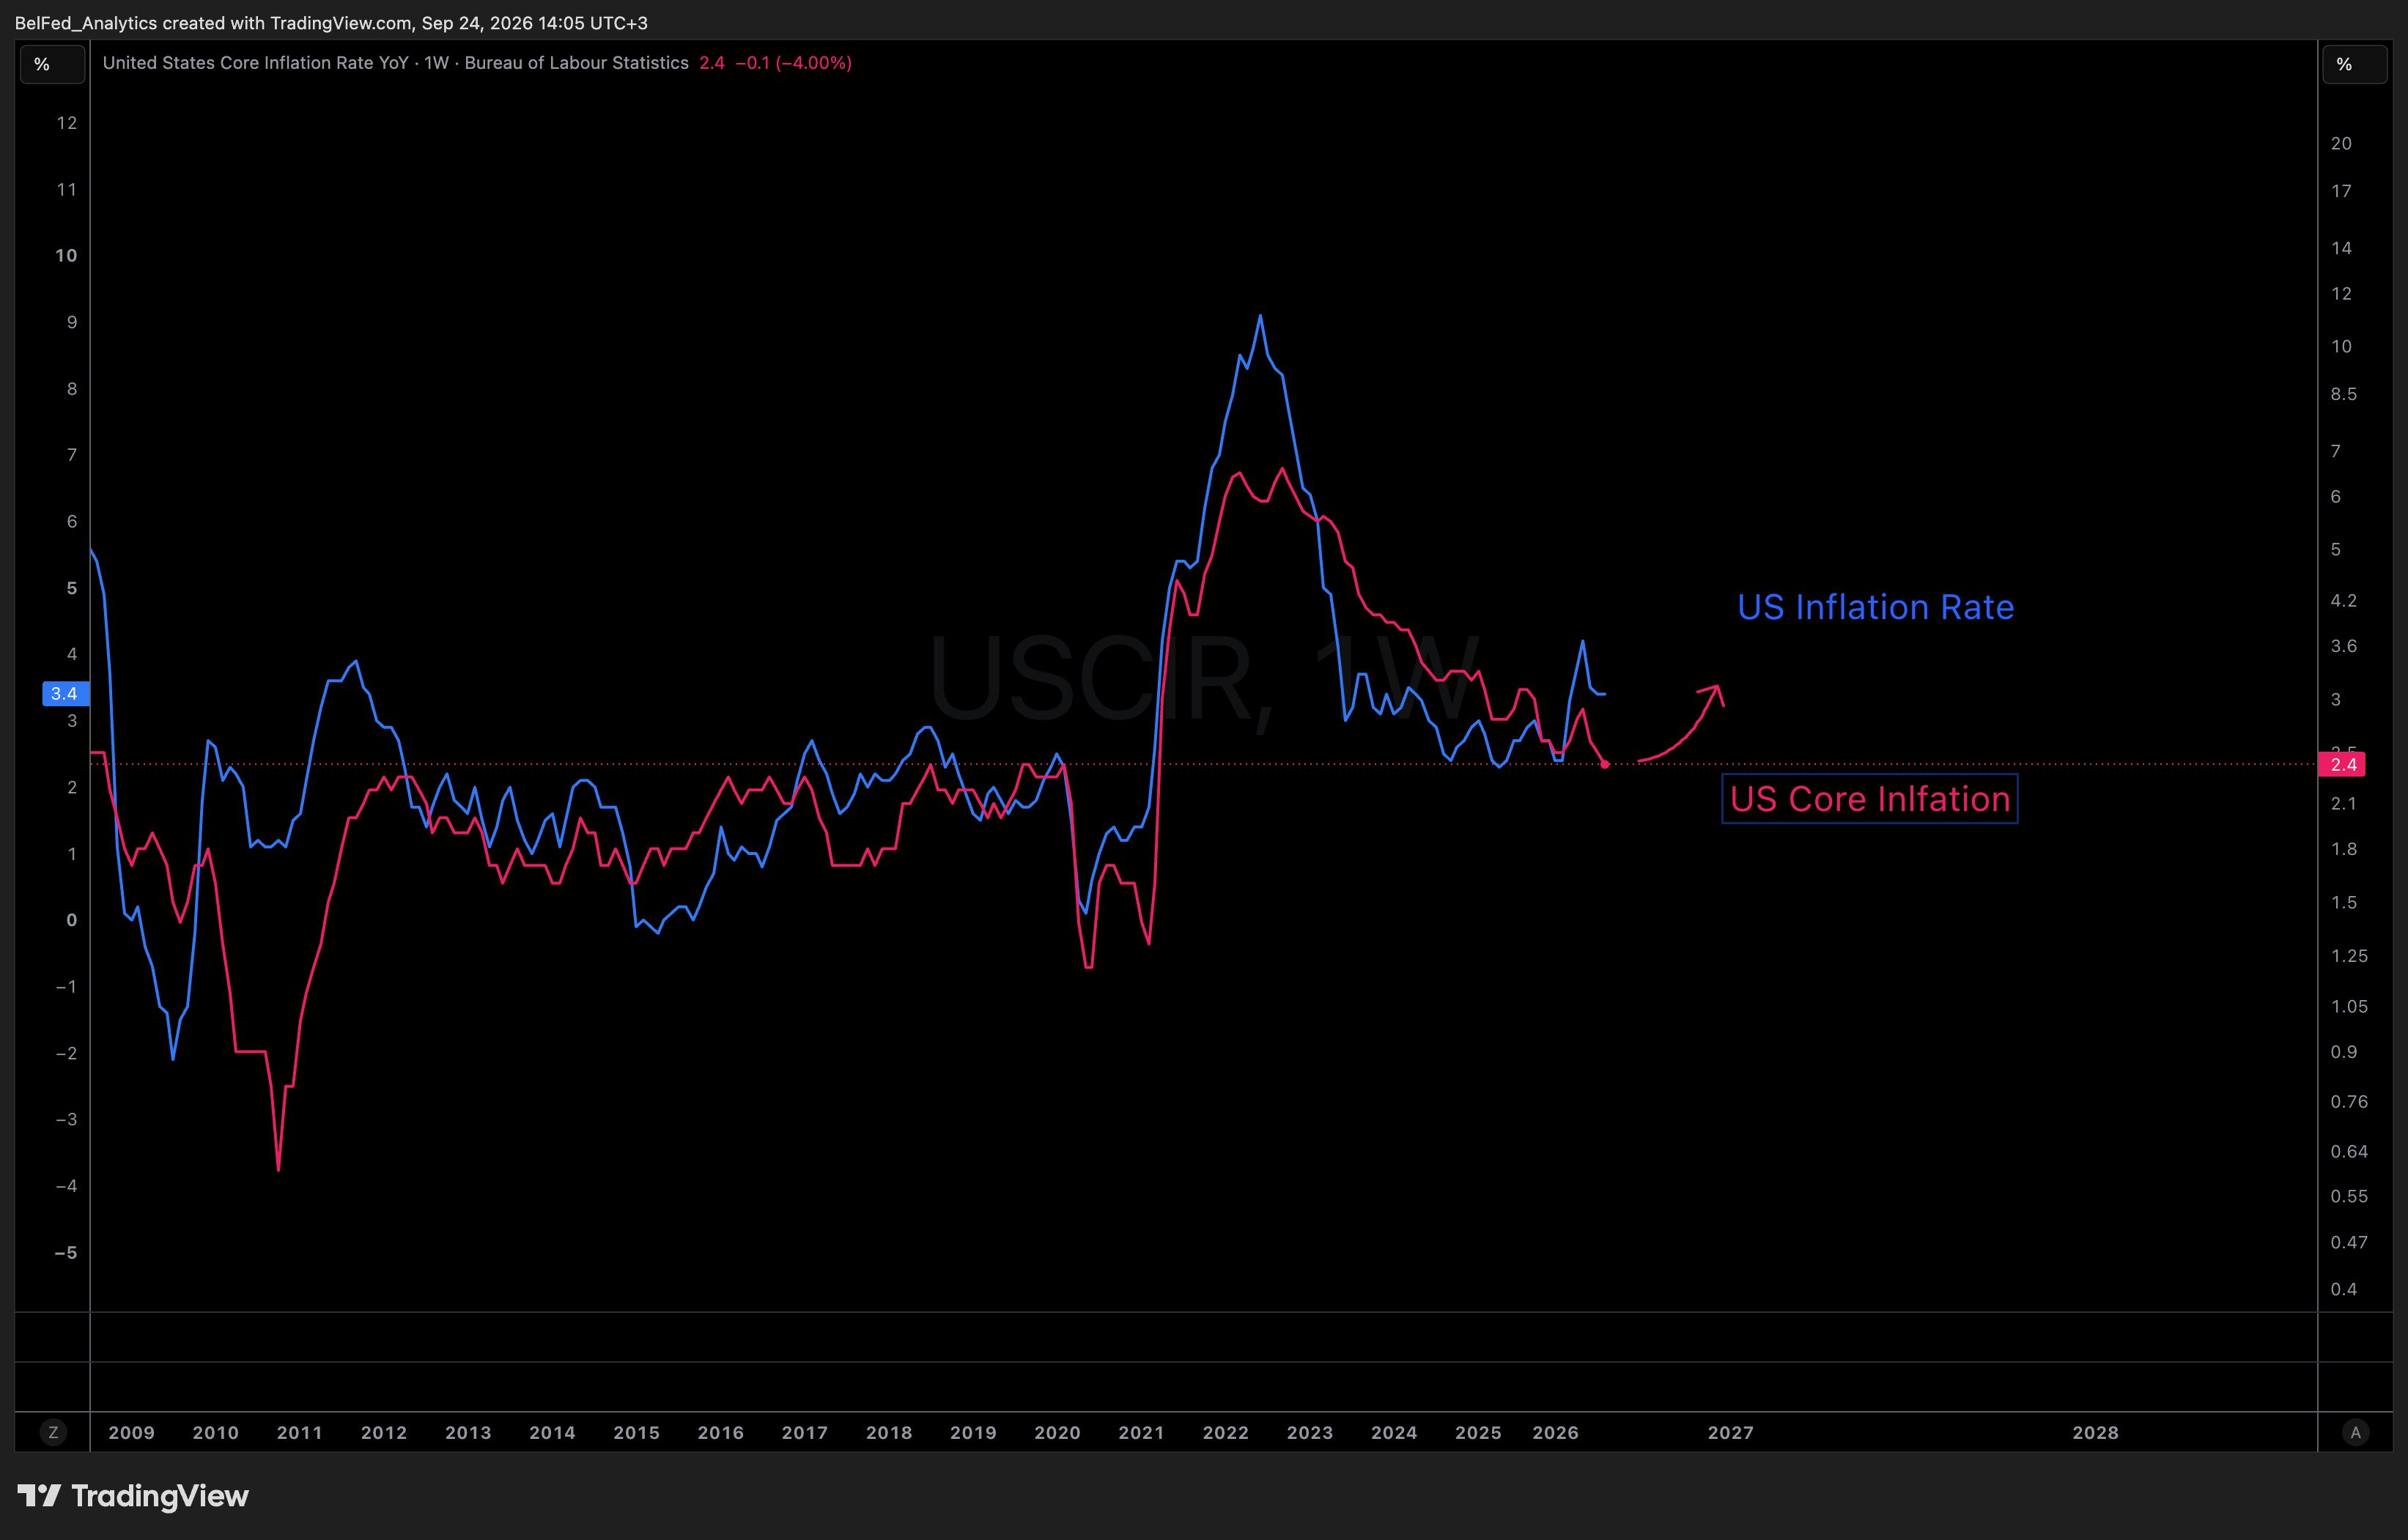
The primary argument against further monetary tightening is that US core inflation is still easing (down to 2.4%). However, core metrics lag. Headline inflation (3.4%), driven by energy and raw materials, consistently turns first before bleeding into broader consumer prices.
US core inflation has now remained above the Fed's 2% objective for roughly 68 consecutive months. A reacceleration before sustainably reaching 2% would create a serious credibility issue for policymakers.
Historically, comparable periods with persistent above-target core inflation occurred in 2000, 2006, and 2021–2022. In every instance, the Fed was forced to raise interest rates.
03
Services Sector Momentum Points to Core Inflation Rebound
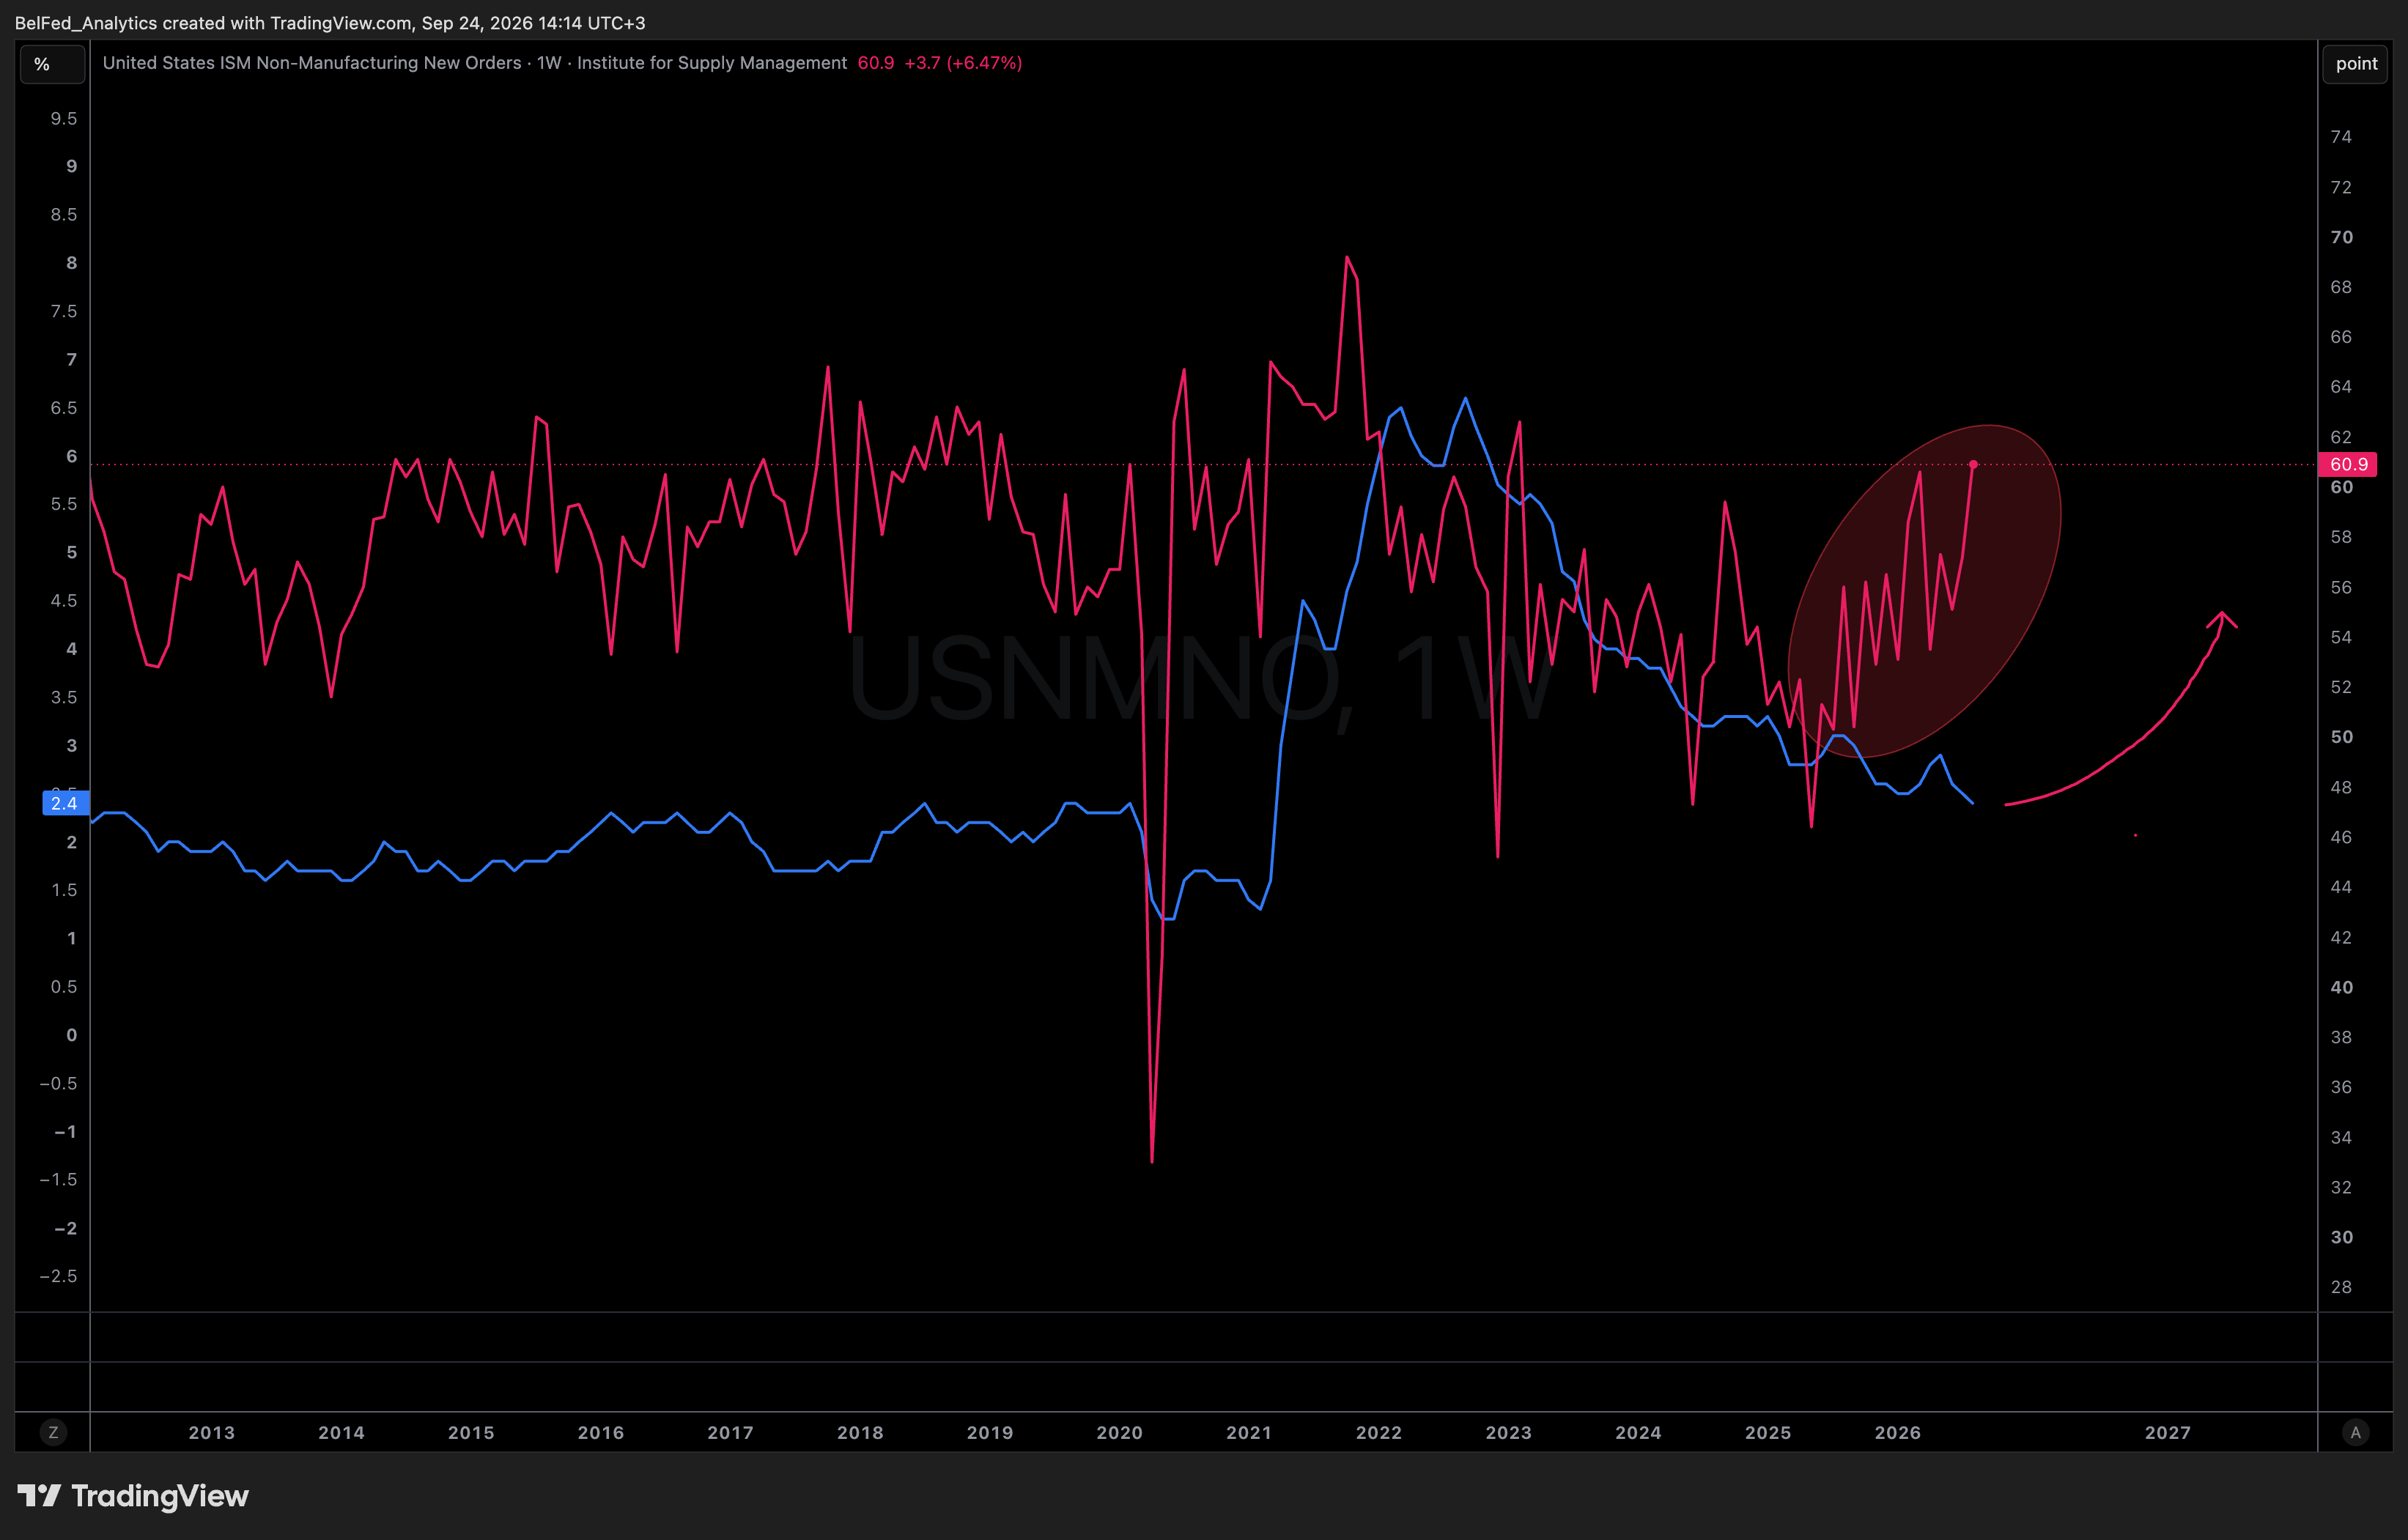
The US ISM Non-Manufacturing gauge surged to 60.9, driven by accelerating new orders and service-sector pricing pressure. Services costs reflect the structural backbone of consumer prices far better than volatile raw materials.
When shifted forward by approximately one year, this indicator historically predicts where core inflation is headed. The recent steep acceleration points directly to a re-expansion in core CPI into early 2027.
The bond market is actively digesting this forward pipeline, driving the aggressive repricing in 2-year Treasury yields.
04
US Yield Curve Flattens Toward Inversion
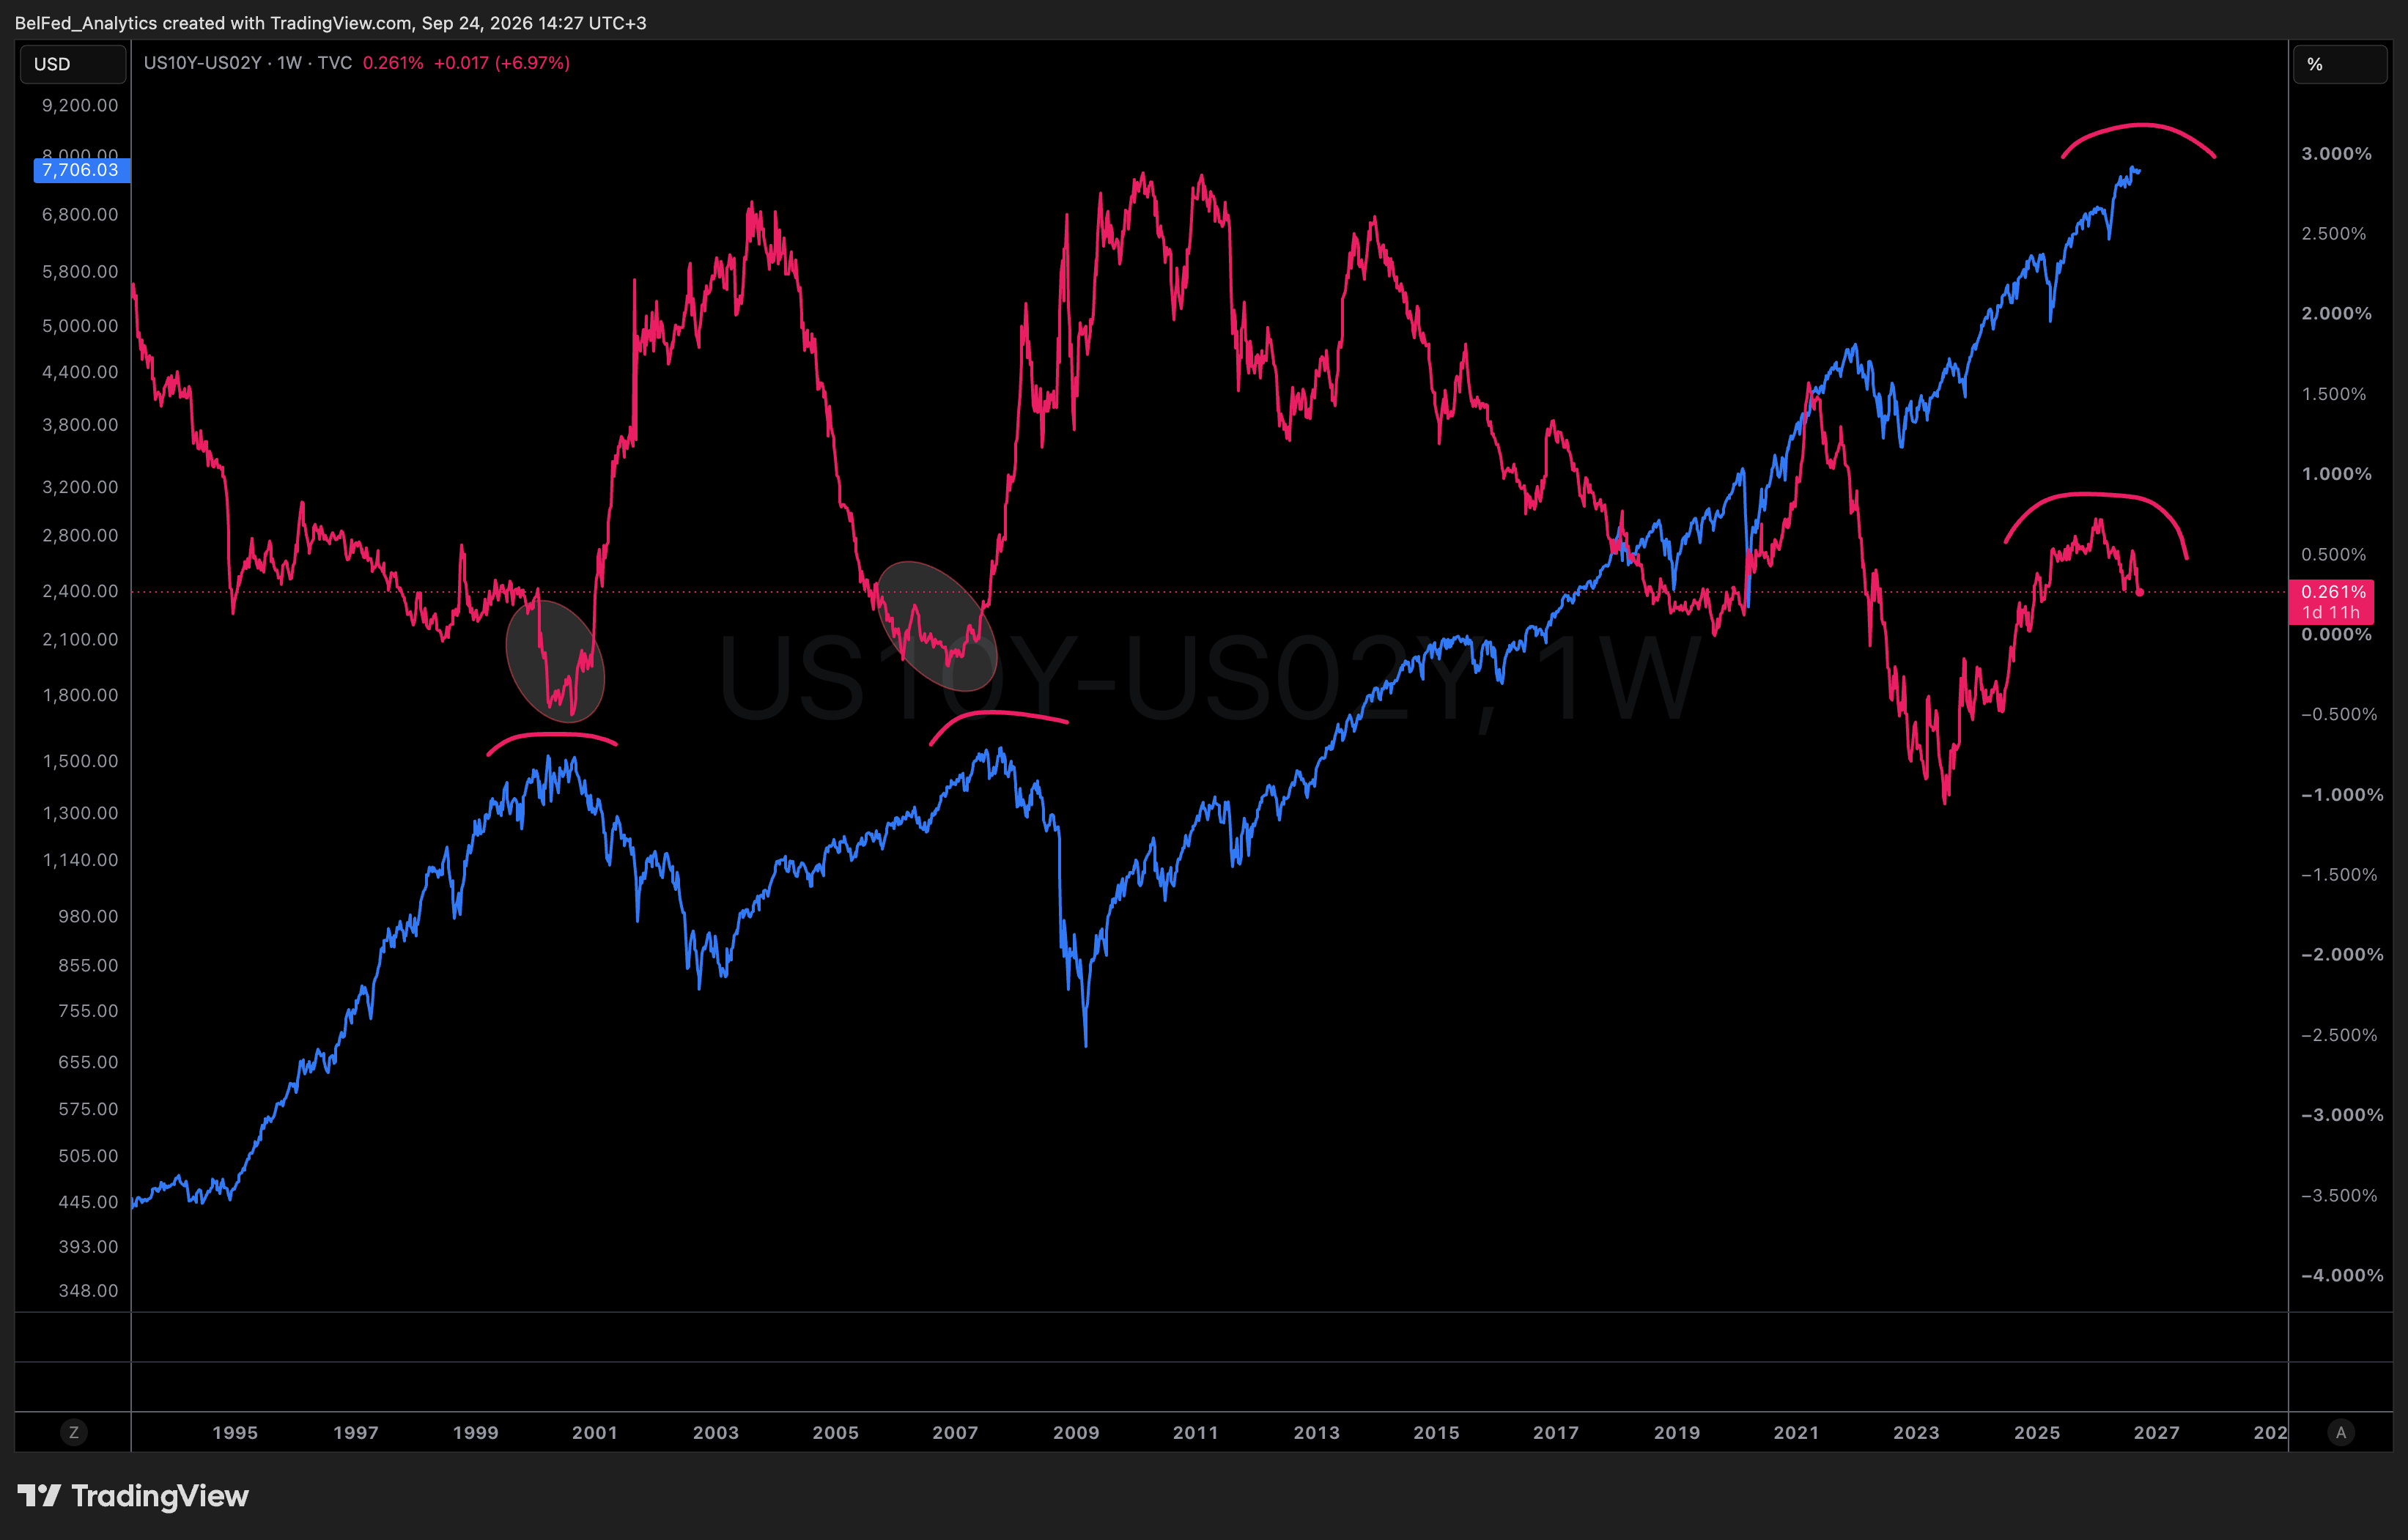
The spread between US 10-year and 2-year Treasury yields has compressed to 0.26%. While not yet inverted, the yield curve is flattening at an accelerating pace.
A steep yield curve encourages bank lending and fuels expansion, whereas flattening and inversion restrict credit flow, historically acting as a classic recession precursor.
If aggressive Fed tightening pushes the curve back into inversion following a massive equity bull run, a cyclical topping process reminiscent of 2000 becomes increasingly plausible.
05
Underlying Market Weakness: S&P 500 Breadth Hits Historic Lows
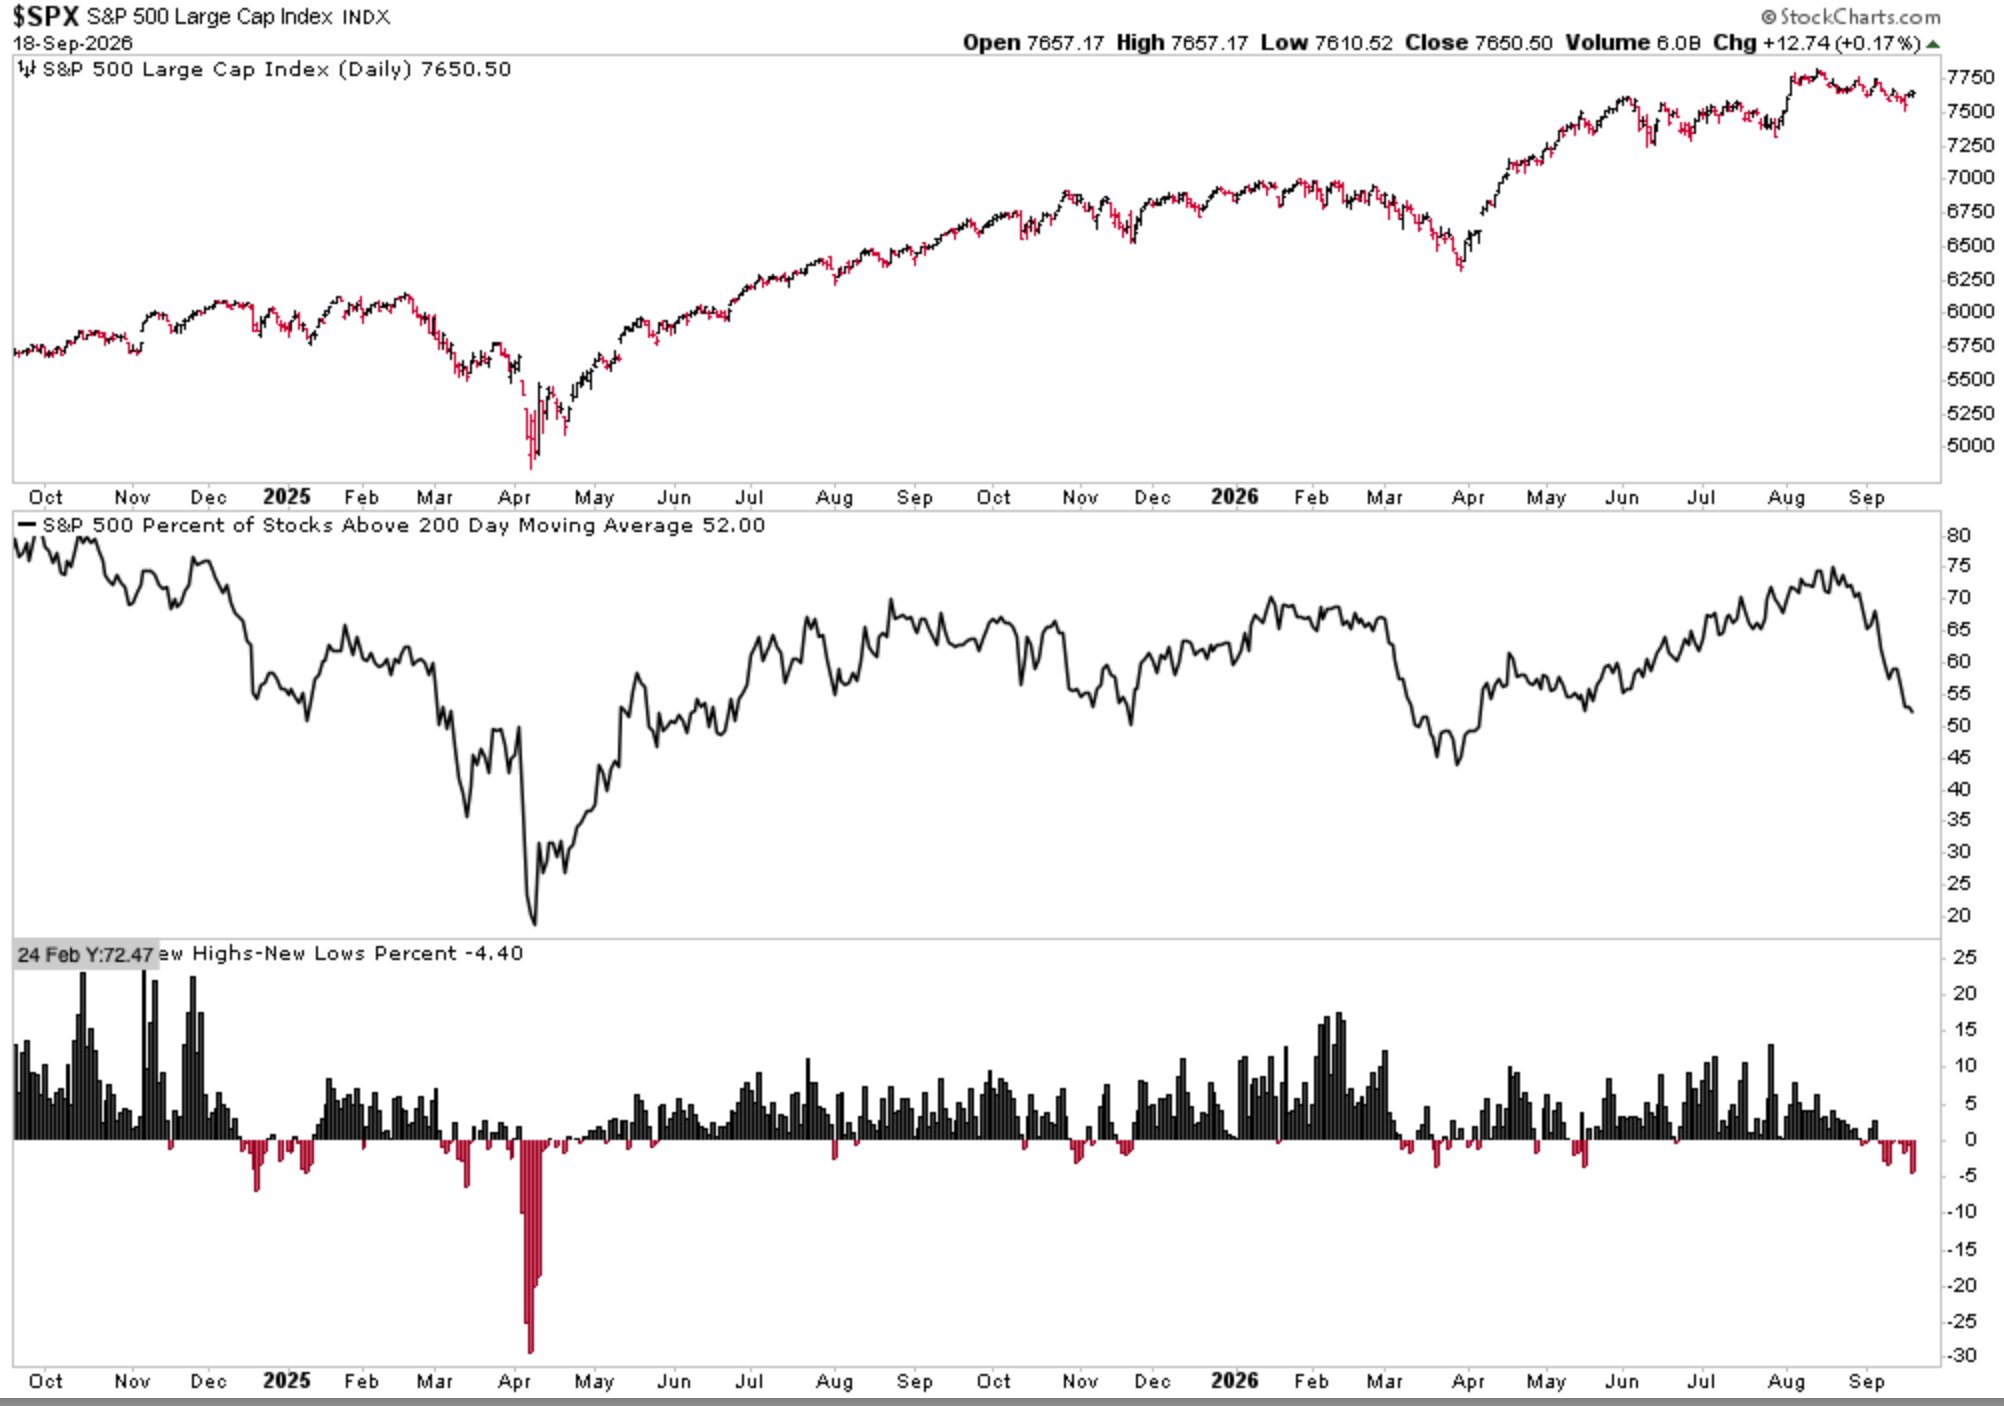
While the headline S&P 500 tests record territory, its internal breadth has collapsed. The share of stocks trading above their 200-day moving average plunged to 52%, with net new lows heavily outpacing new highs. Historically, comparable breadth divergences were recorded only in January 1973 and November 1999 ahead of major cycle tops.
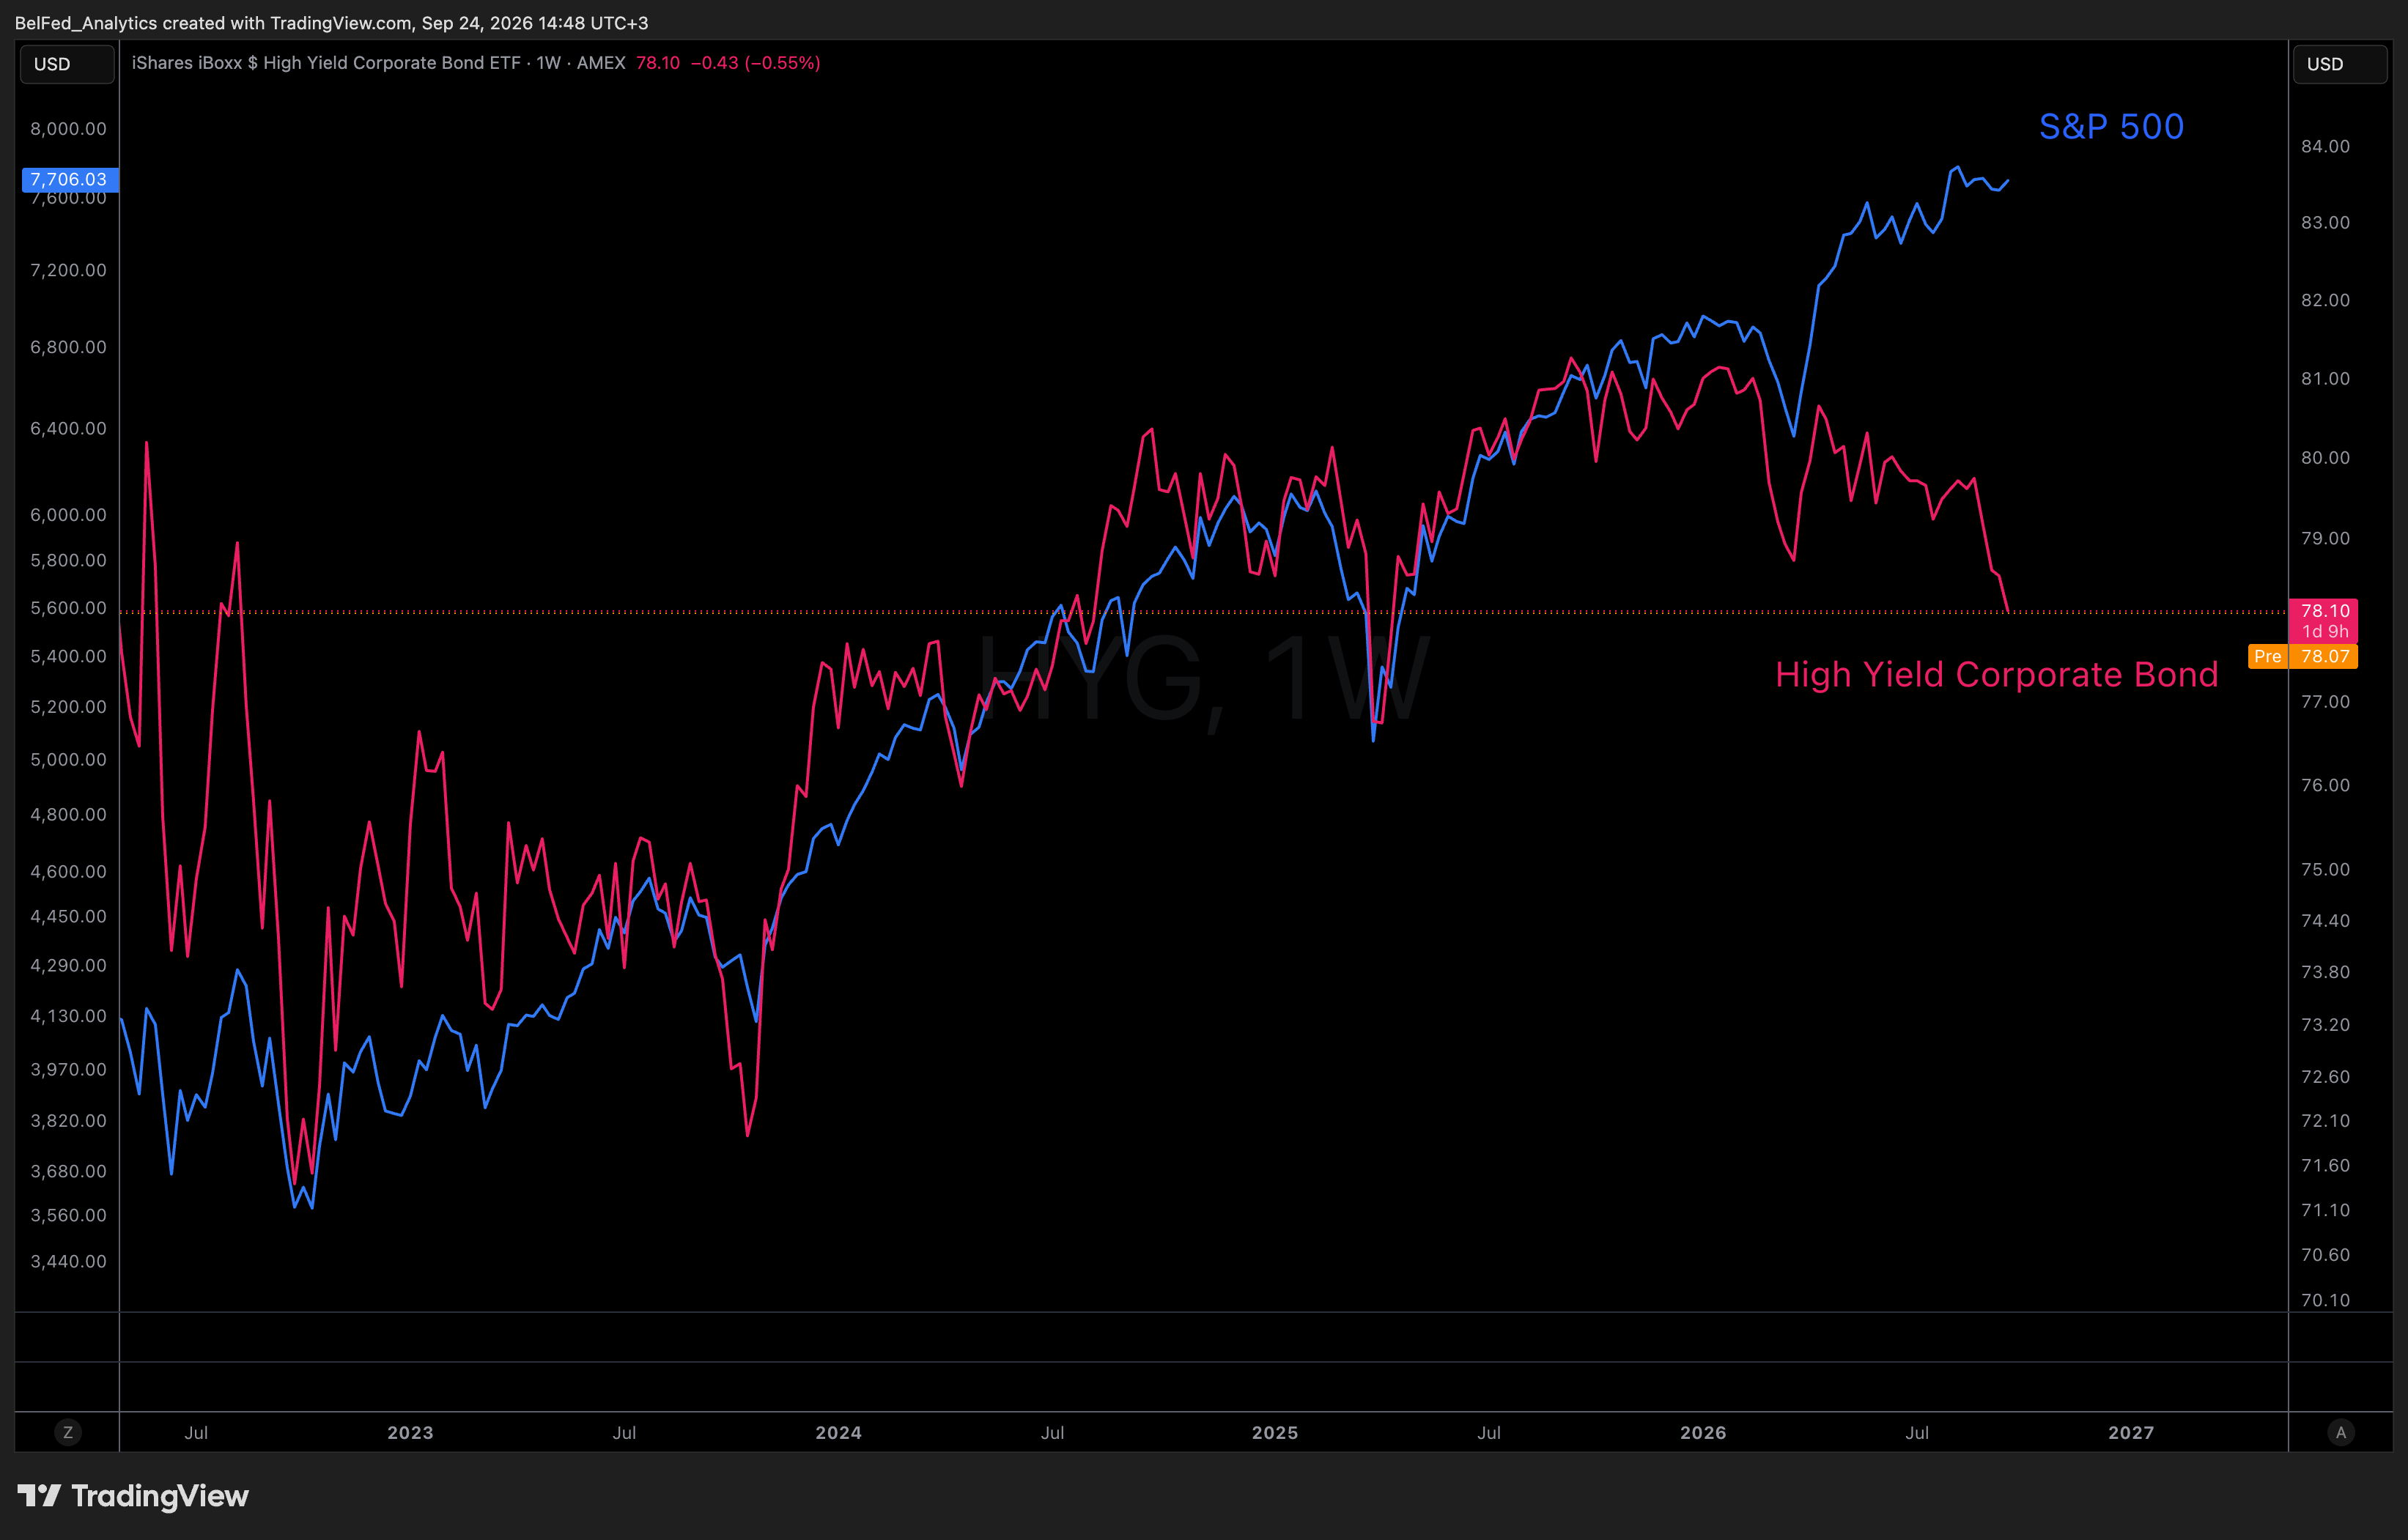
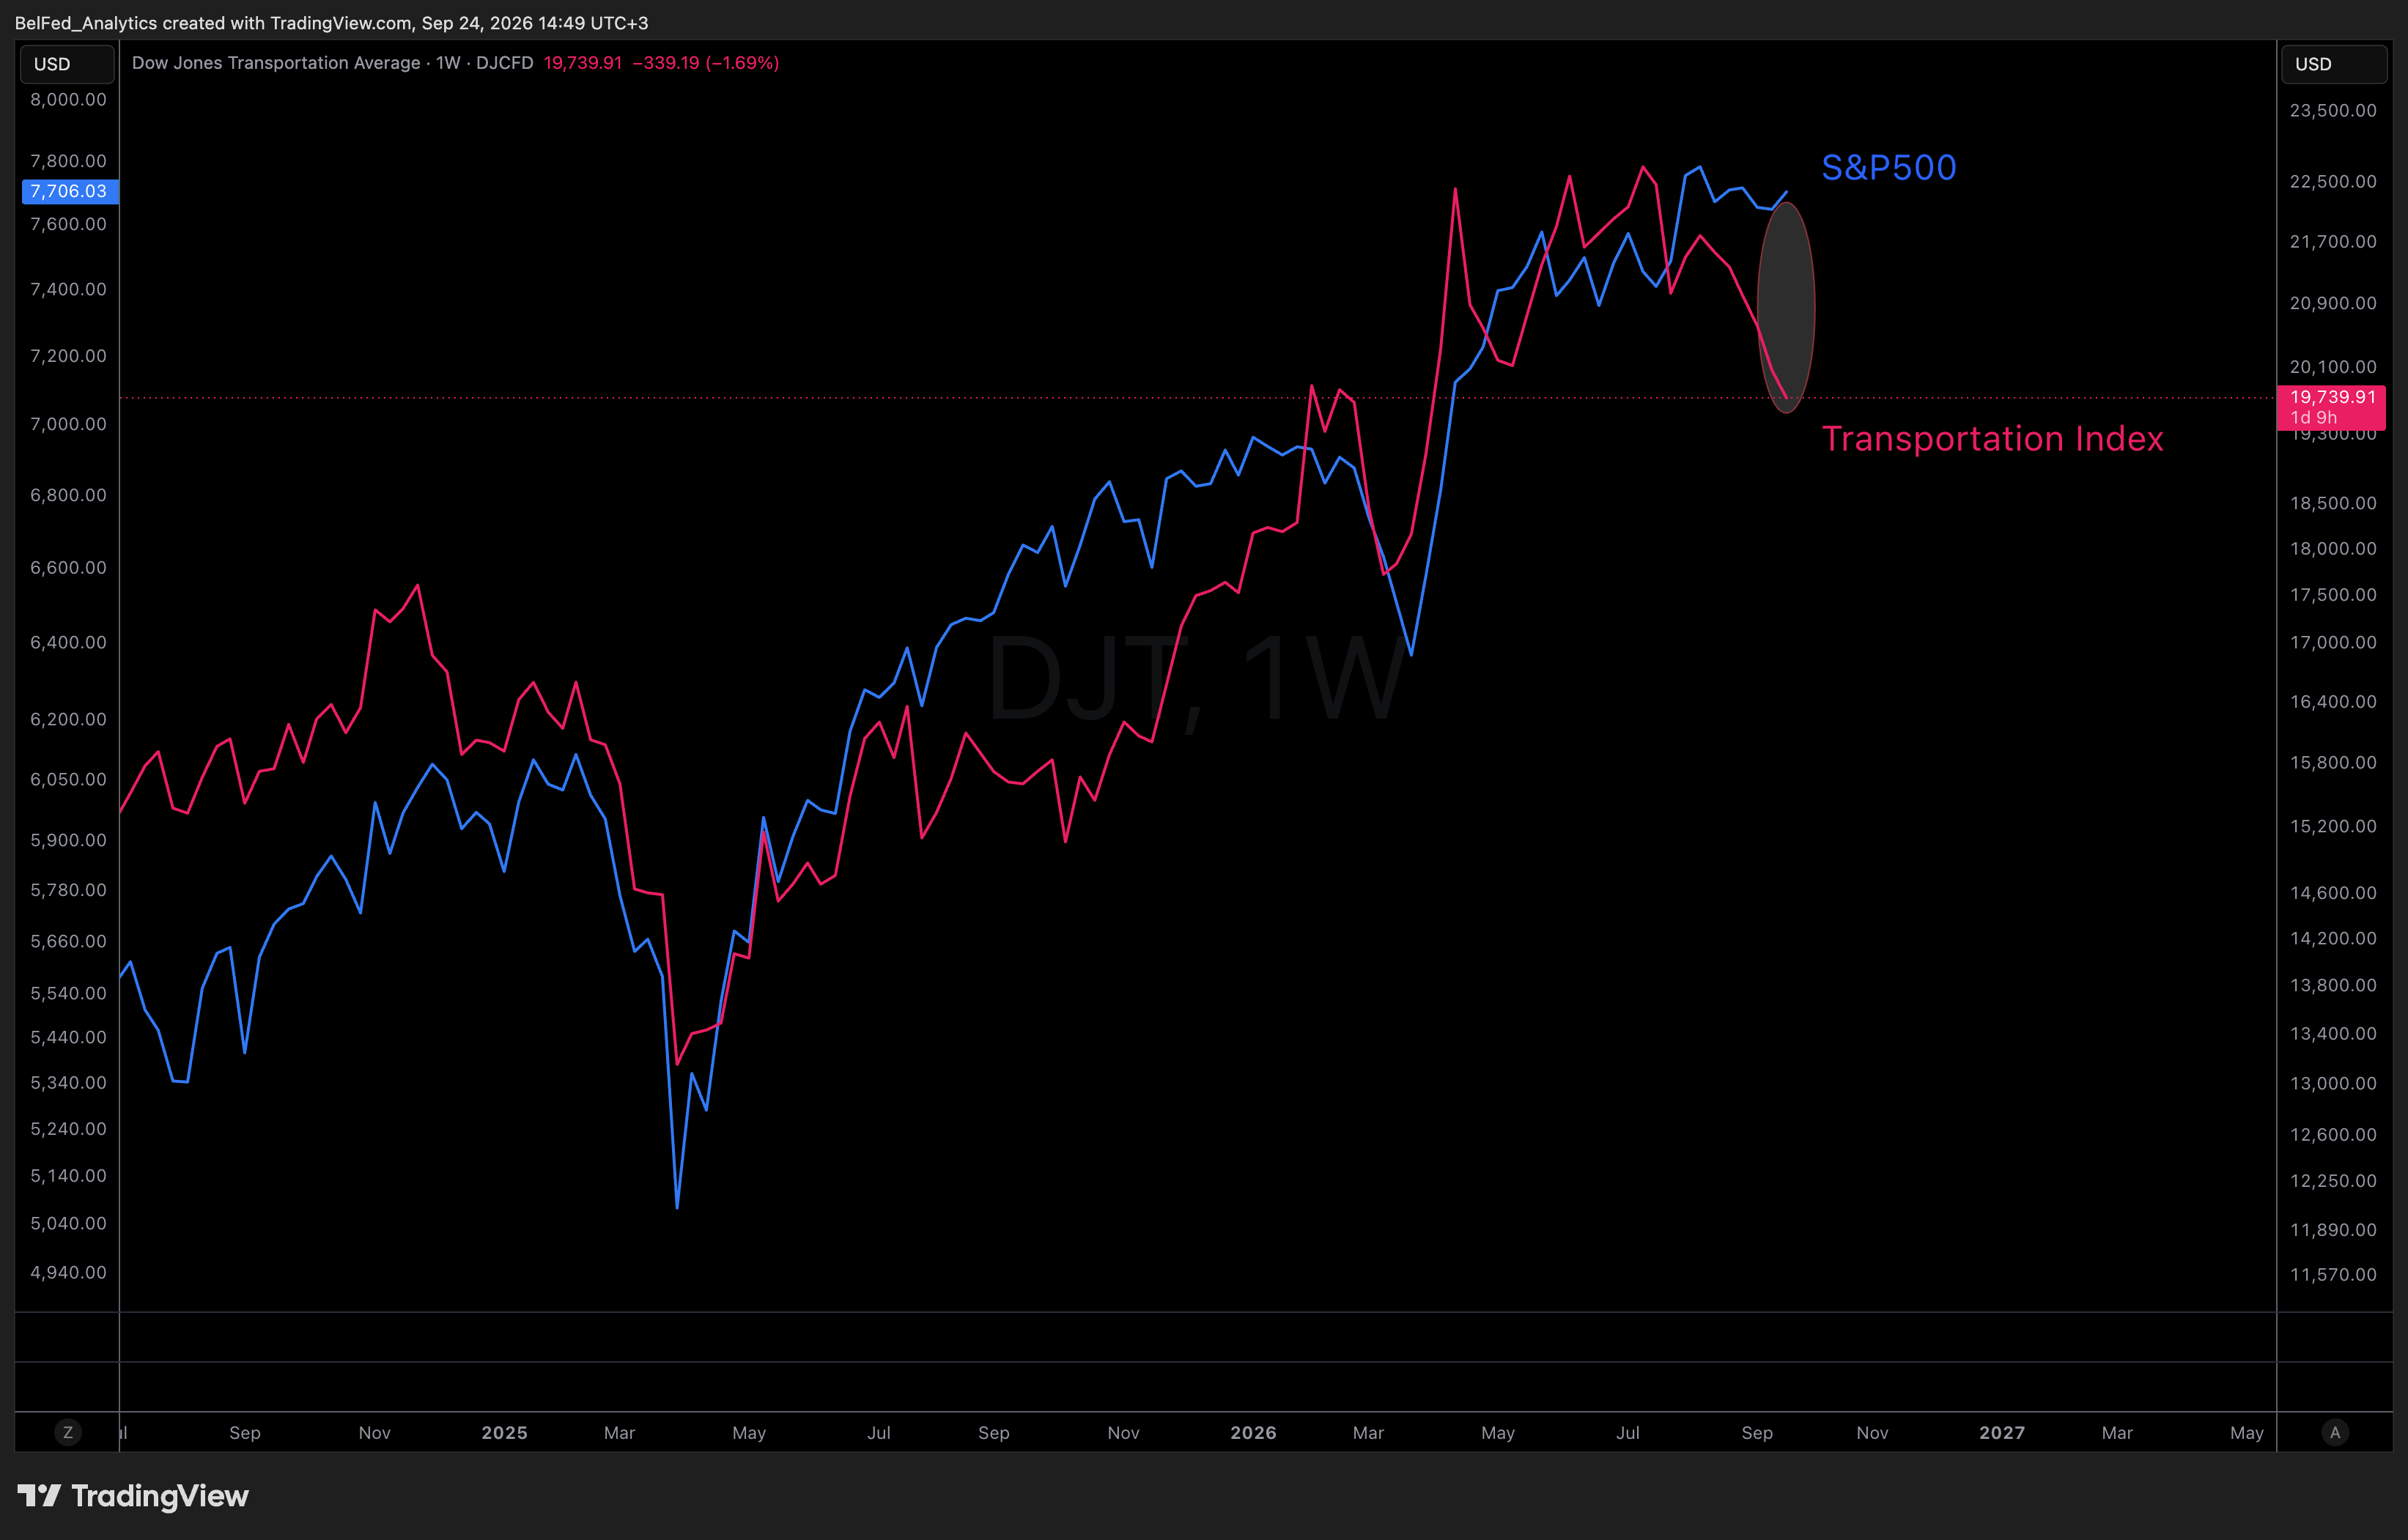
Cross-asset indicators confirm rising fragility: high-yield credit (HYG) has decoupled from equities to head lower for the first time since 2022, while the Dow Jones Transportation Average is moving in sharp negative divergence with the S&P 500.
The broader market is being masked by a few mega-caps. Barring a dovish policy shift from the Fed, this extreme lack of participation leaves equities vulnerable to a broader repricing.
06
Parallels to Late 1999: Tech Decouples From Macro Realities
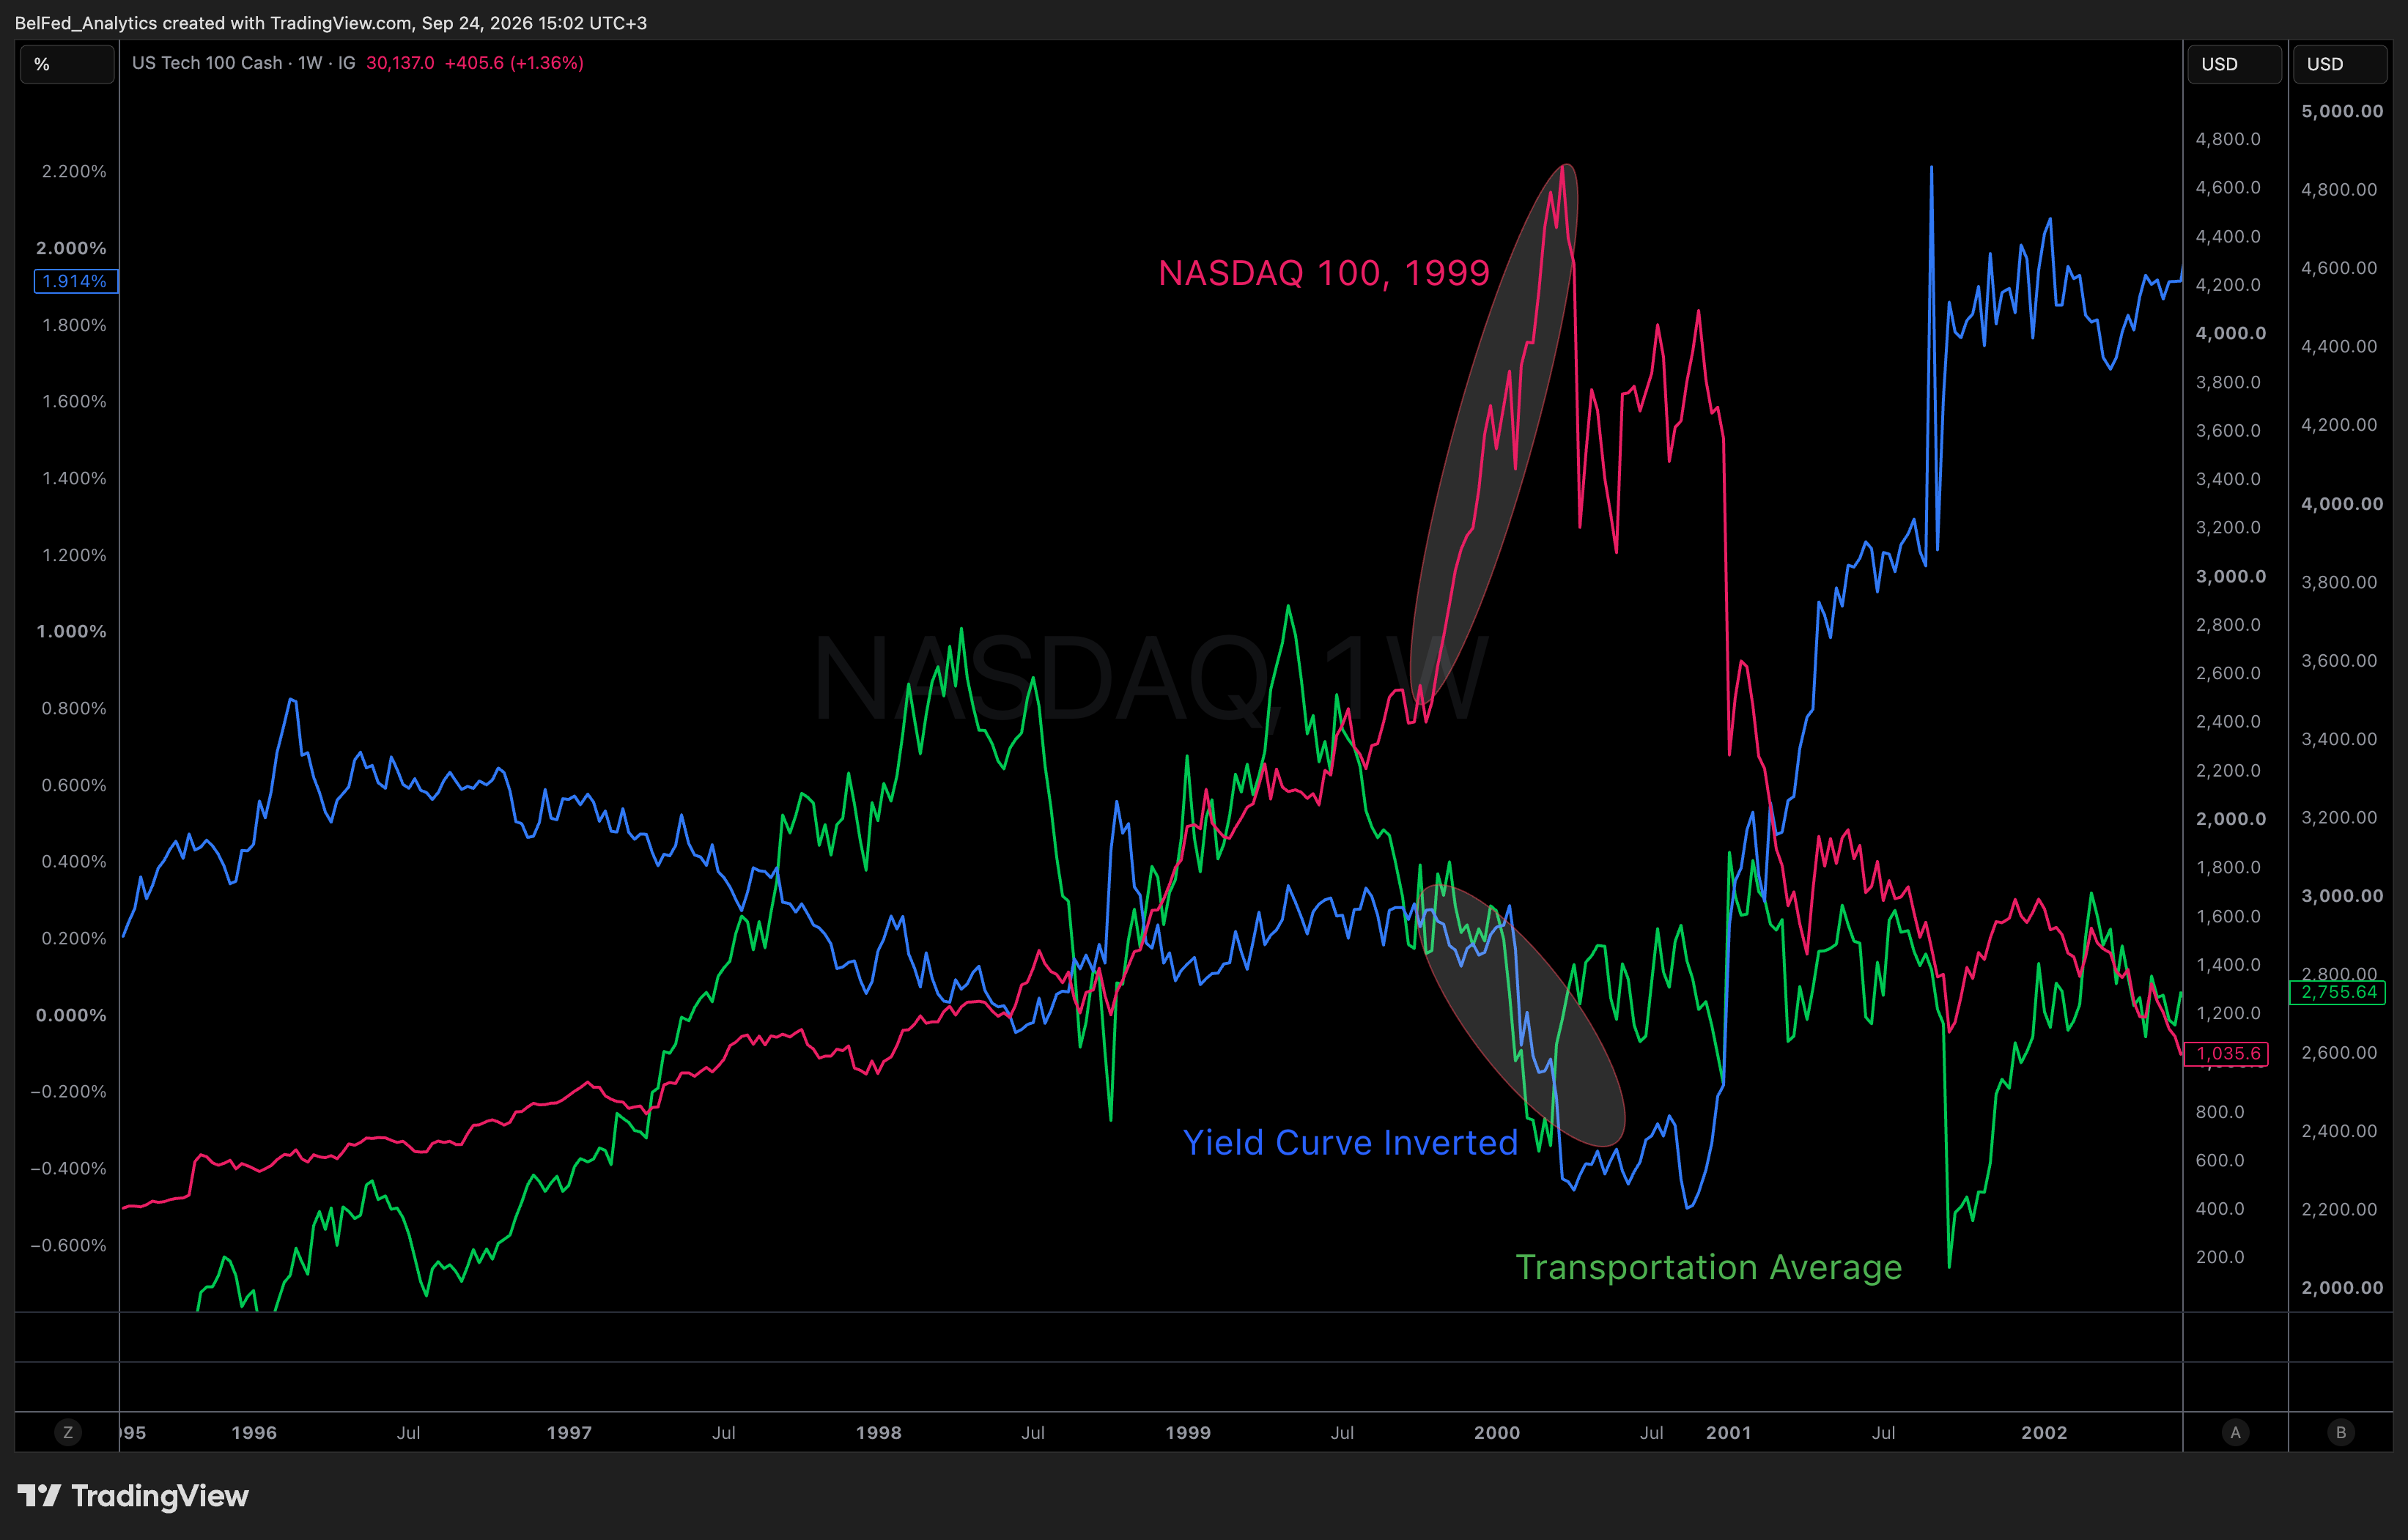
The narrow, tech-led momentum holding up the market bears striking similarities to the final stages of 1999.
In October 1999, the US yield curve inverted while transport and small-cap stocks were already breaking down. Yet the Nasdaq pushed higher in a speculative run as investors assumed the internet revolution was immune to rising rates. Eventually, tightening credit conditions brought the entire expansion to an end.
While calling an immediate market top remains premature, the historical data suggests the market may be entering a late-cycle phase.
07
Three Macro Scenarios for Equities
The trajectory of bond yields outlines three distinct paths for financial markets:
1. Bullish reversal: Geopolitical de-escalation and the full reopening of the Strait of Hormuz could push oil down toward $60 (-40%), cooling inflation and removing the need for Fed rate hikes.
2. Base case: Yields drift modestly higher, tipping the curve back into inversion and gradually squeezing bank credit and corporate earnings.
3. Worst case: The 2-year Treasury yield climbs to 5.5% by early 2027, marking the terminal phase of the equity expansion and setting up a broad cyclical downturn.
We've already mapped entries on the tickers in this report.
Levels, stops, and targets live inside the members area and Telegram, pushed the moment a setup triggers. Start a 14-day trial and get access before we open the first position in this theme. No card required.