
01
Gold faces a critical technical test near the $4,000 support zone
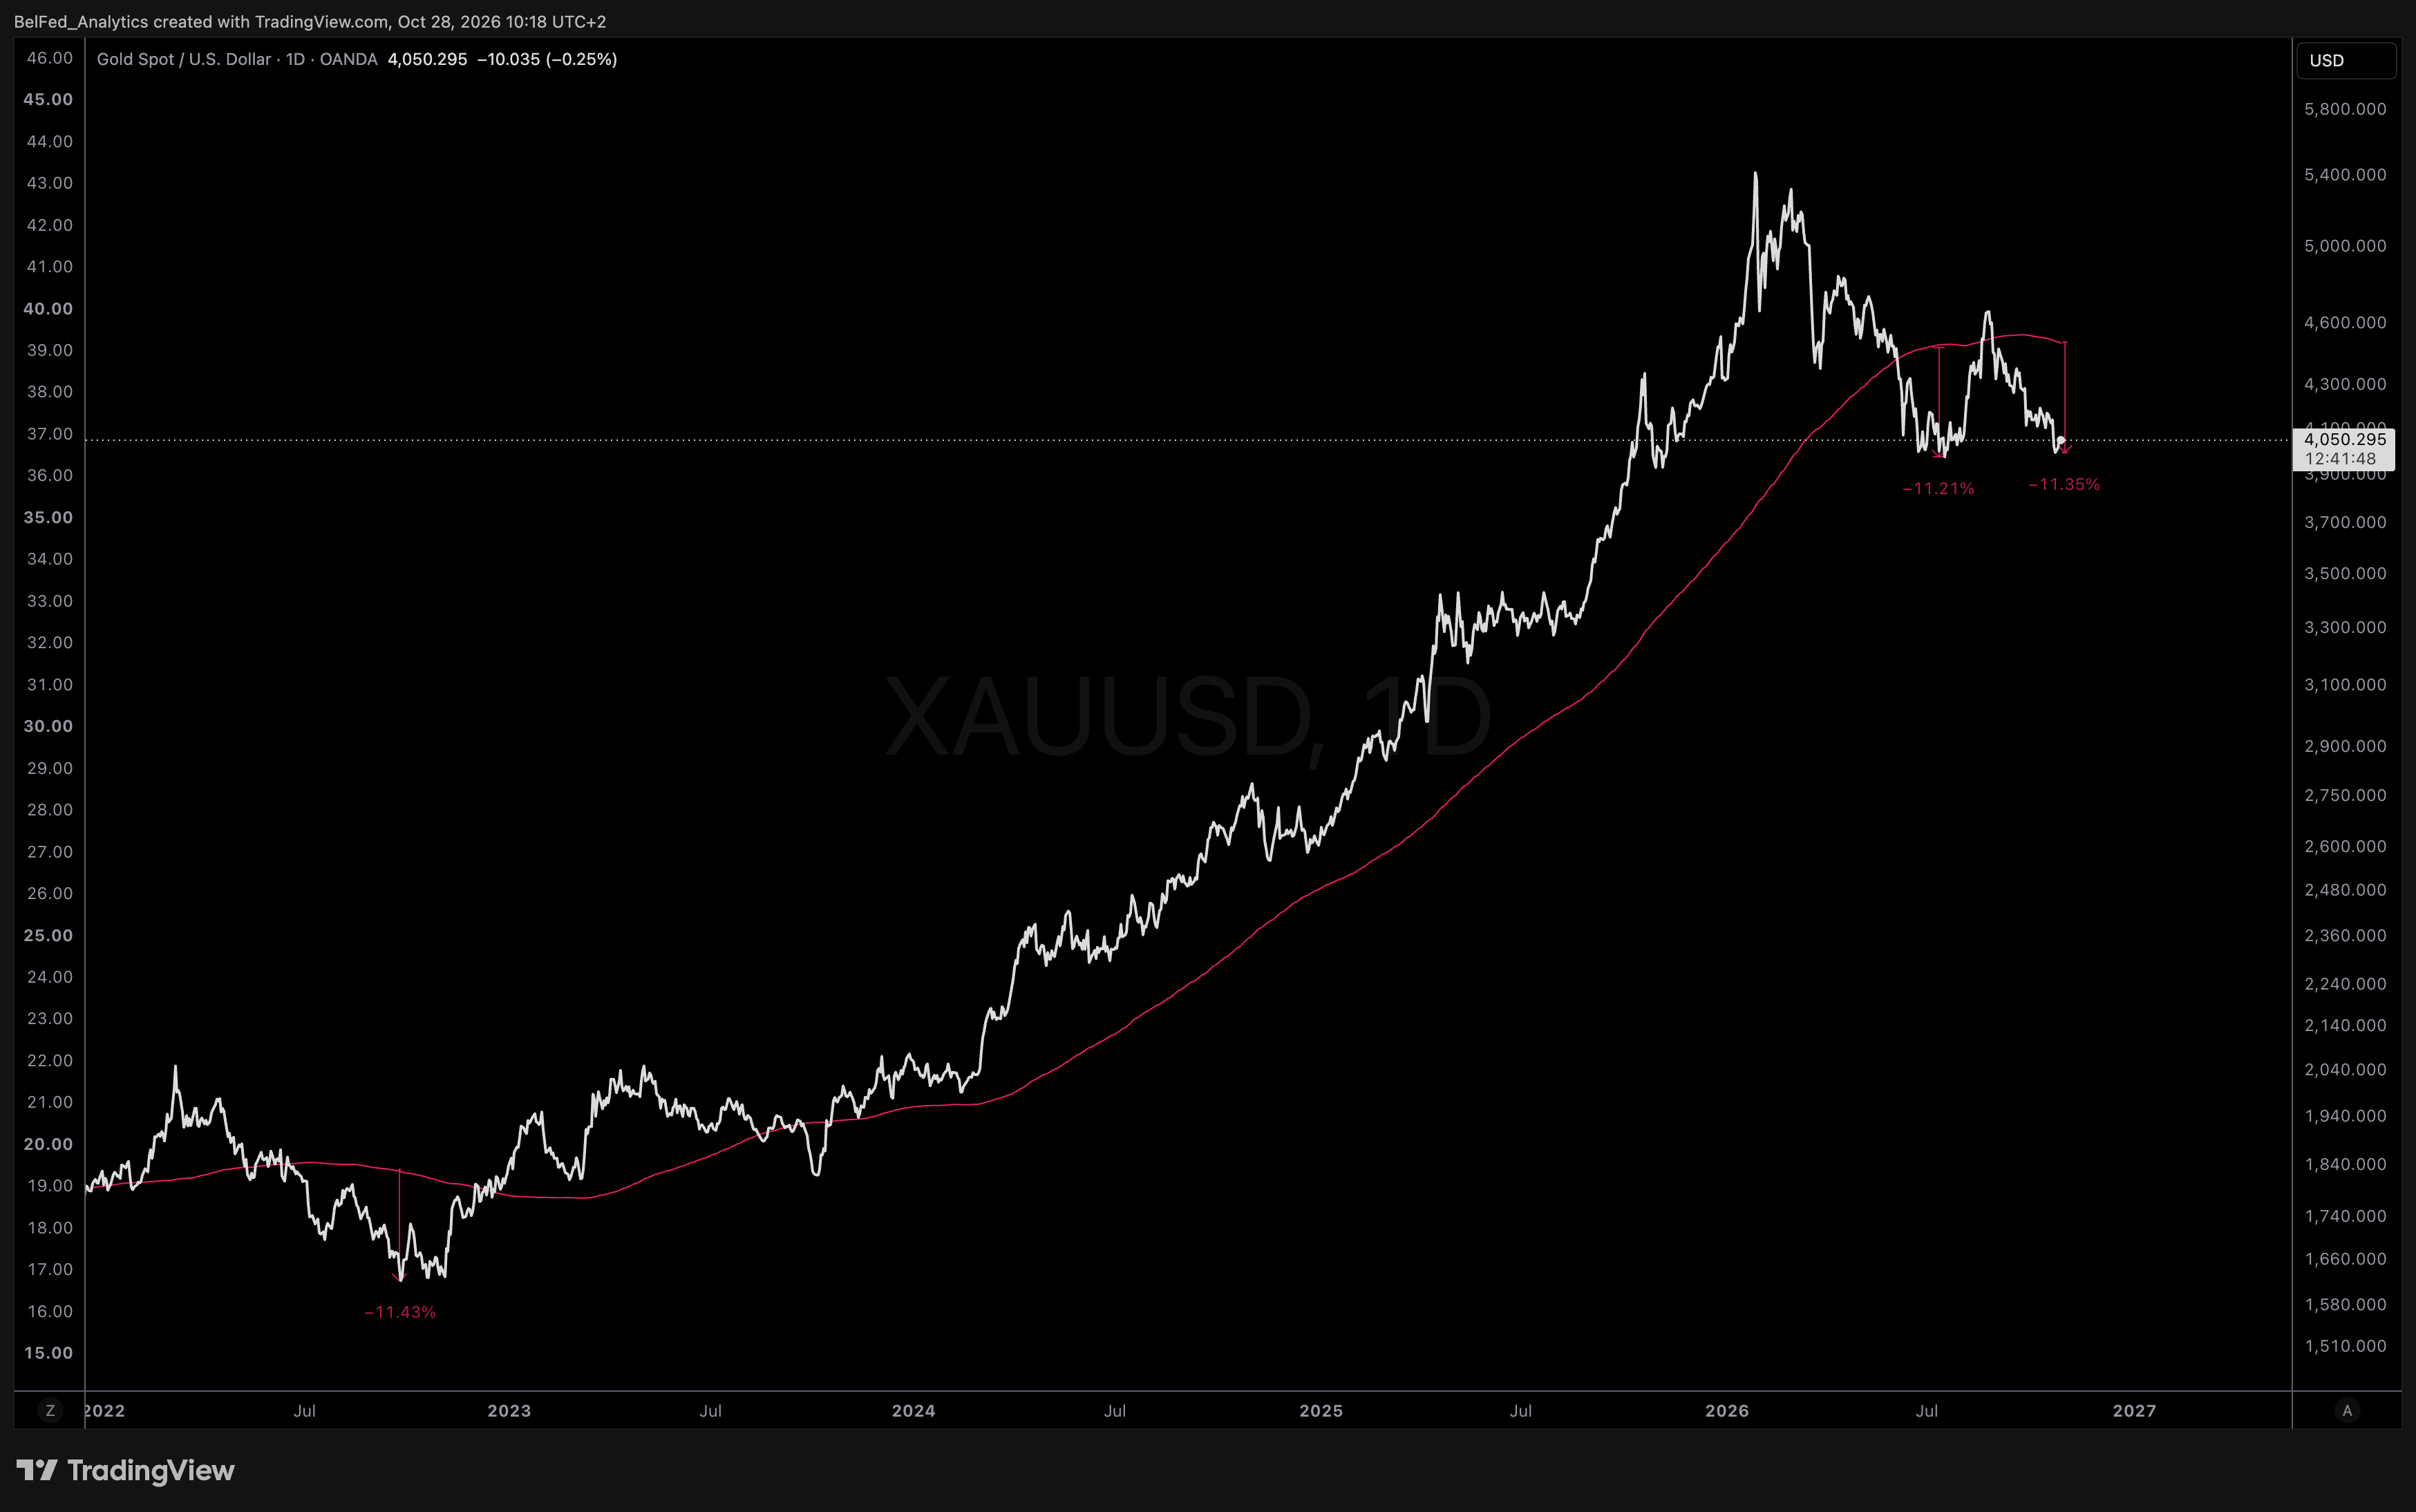
The $4,000 level remains a vital line in the sand for gold, having acted as reliable support several times this summer. Prices are now trading more than 11% below the 200-day moving average, matching the technical deviation seen at the summer lows and late 2022.
Initial overhead resistance sits near $4,125, aligning directly with the 21-day moving average. Holding the $4,000 floor represents a major technical test for bullish investors.
02
Gold ETF records largest weekly outflow since March
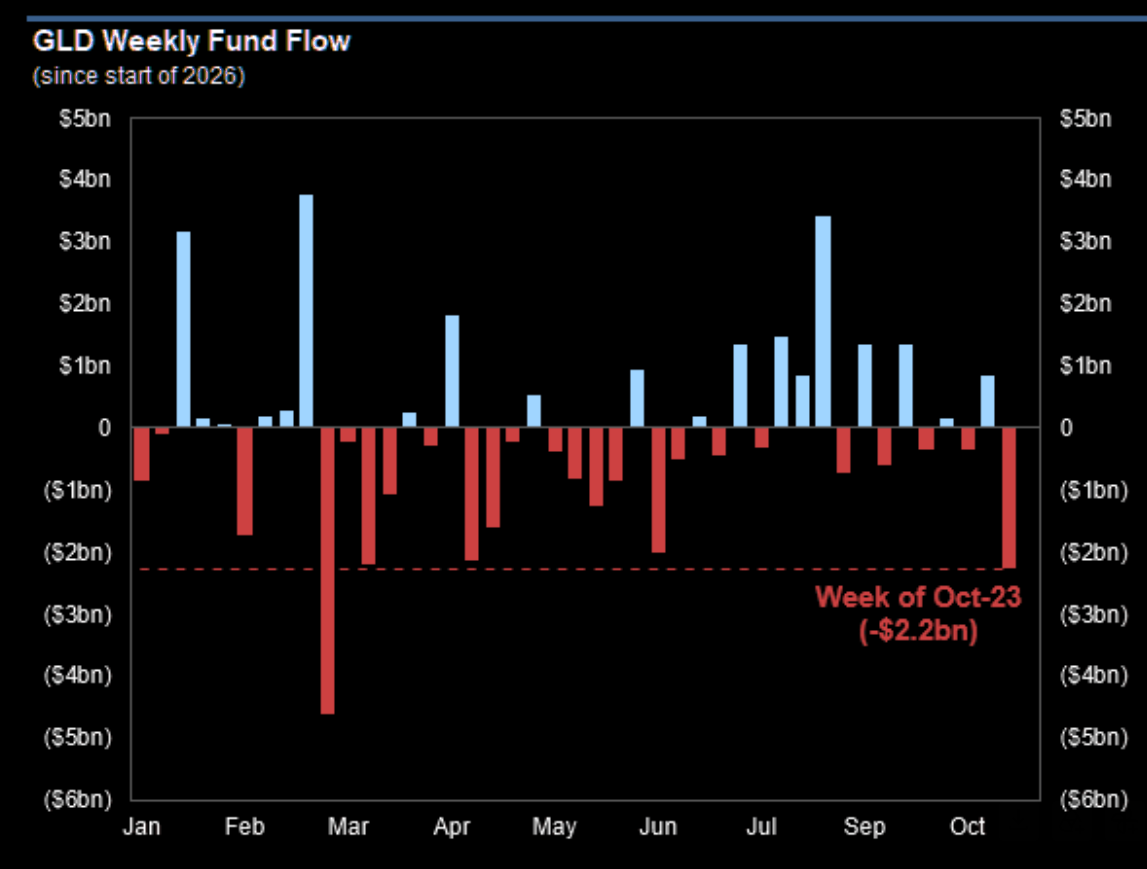
The SPDR Gold Trust (GLD) just posted its largest weekly outflow since March, losing $2.2 billion during the week of October 23. Investors are rushing for the exits following the recent pullback across precious metals.
Historically, sharp spikes in fund redemptions after a steep correction reflect emotional capitulation. The key question now is whether late sellers are liquidating positions right into a potential market bottom.
03
Trend-following funds build substantial short positions in gold
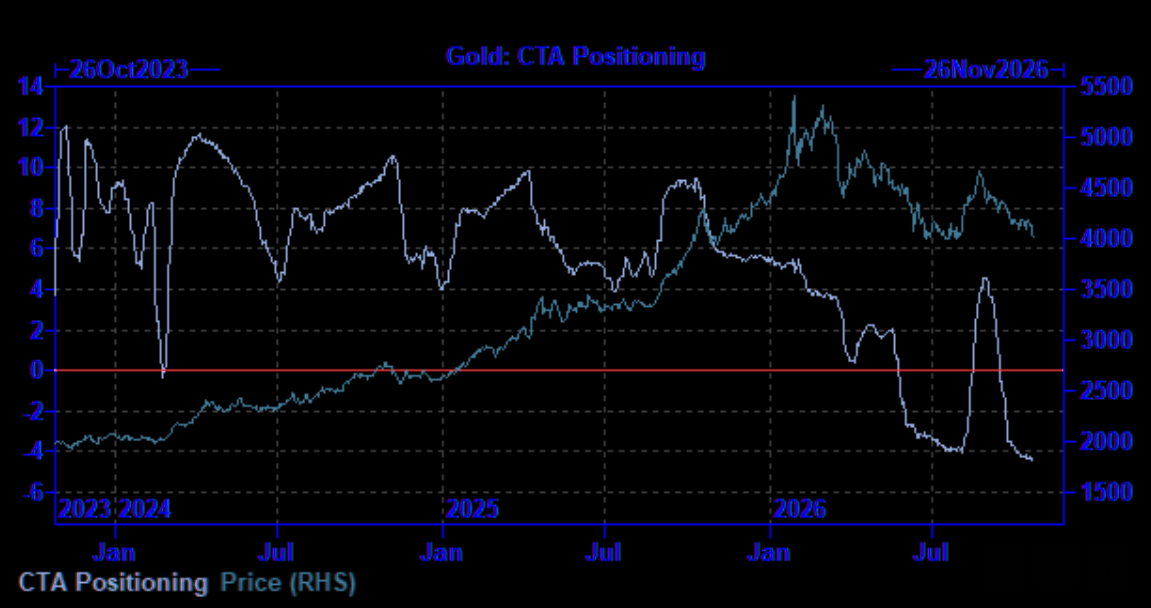
Systematic trend-following funds (CTAs) are currently running sizable short positions in gold. According to Goldman Sachs, algorithmic positioning has plunged deep into negative territory, reaching its most bearish reading in years.
The last time CTA positioning was stretched this far to the downside was right before the sharp August short squeeze. While history does not have to repeat, the current market structure is becoming increasingly compelling if prices stabilize and force systematic covering.
04
Gold rebound could trigger a massive wave of systematic buying
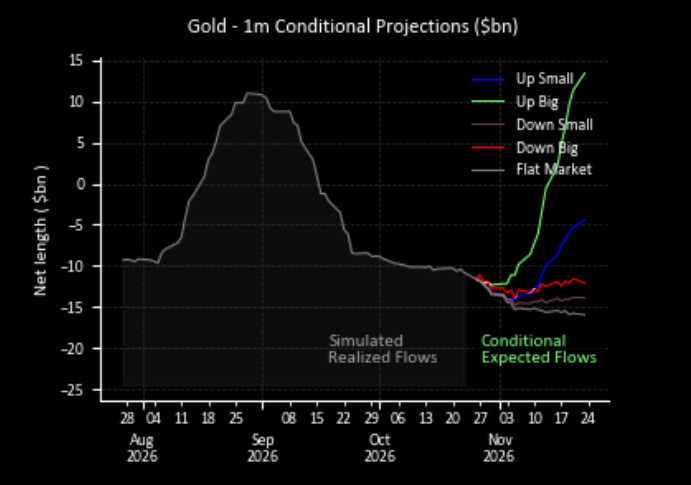
Goldman Sachs' CTA models highlight strong upside flow asymmetry if gold begins to recover. Because systematic trend-following strategies already hold heavy short positions, a sustained price bounce would force algorithms to aggressively cover shorts and flip into net buyers.
While further downside would generate minimal additional selling, a strong rally could unleash over $25 billion in systematic buying demand over the next month. The stretched positioning that amplified the recent selloff could quickly become fuel for the next upward squeeze.
05
Sustained gold recovery may require the US dollar to roll over
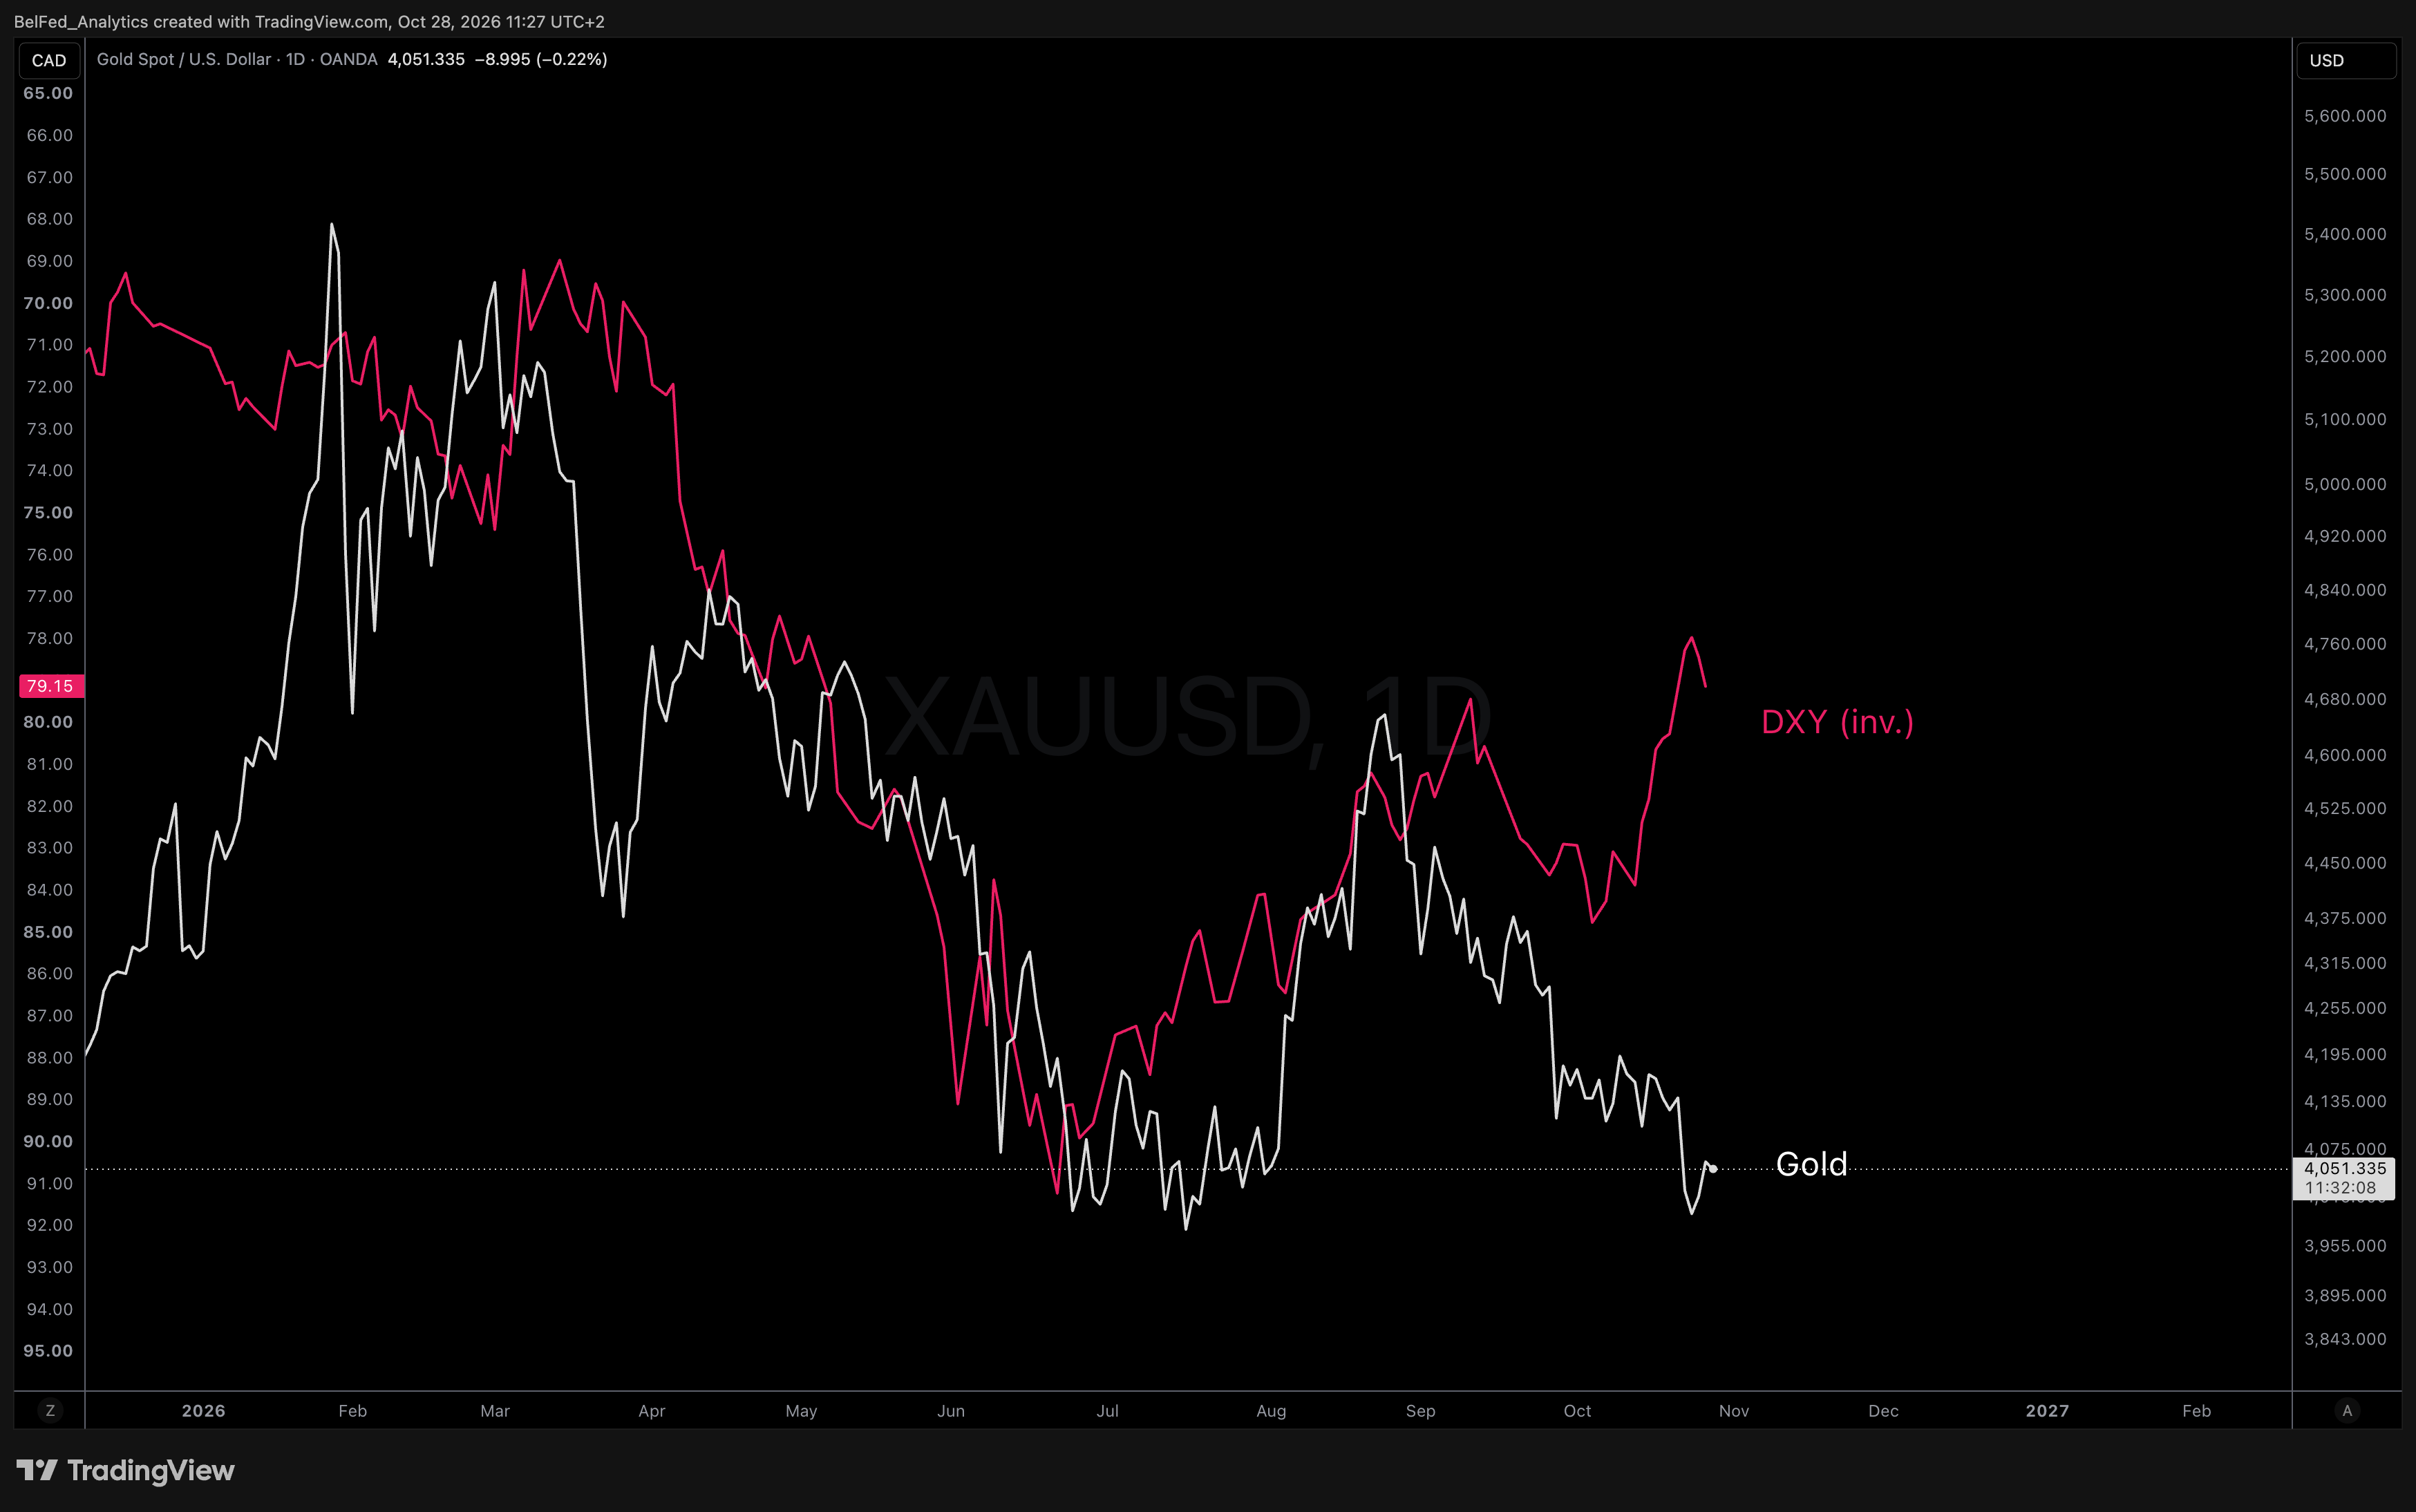
Before getting overly optimistic about a gold rebound, traders should keep a close watch on the US dollar. Throughout the entire year, the two assets have traded in a nearly textbook inverse correlation.
Persistent strength in the US Dollar Index (DXY) continues to act as a direct headwind for bullion. A durable upward reversal in gold will likely require the dollar's momentum to stall and turn lower first.
06
Gold and dollar divergence points to a potential catch-up bounce
From March through September, gold and the US dollar moved lower together, with a weakening DXY accompanied by a steady slide in bullion prices. …

The rest of this section and its charts are open to subscribers. The first 14 days are free.
Subscribe to read in full →We've already mapped entries on the tickers in this report.
Levels, stops, and targets live inside the members area and Telegram, pushed the moment a setup triggers. Start a 14-day trial and get access before we open the first position in this theme. No card required.