
01
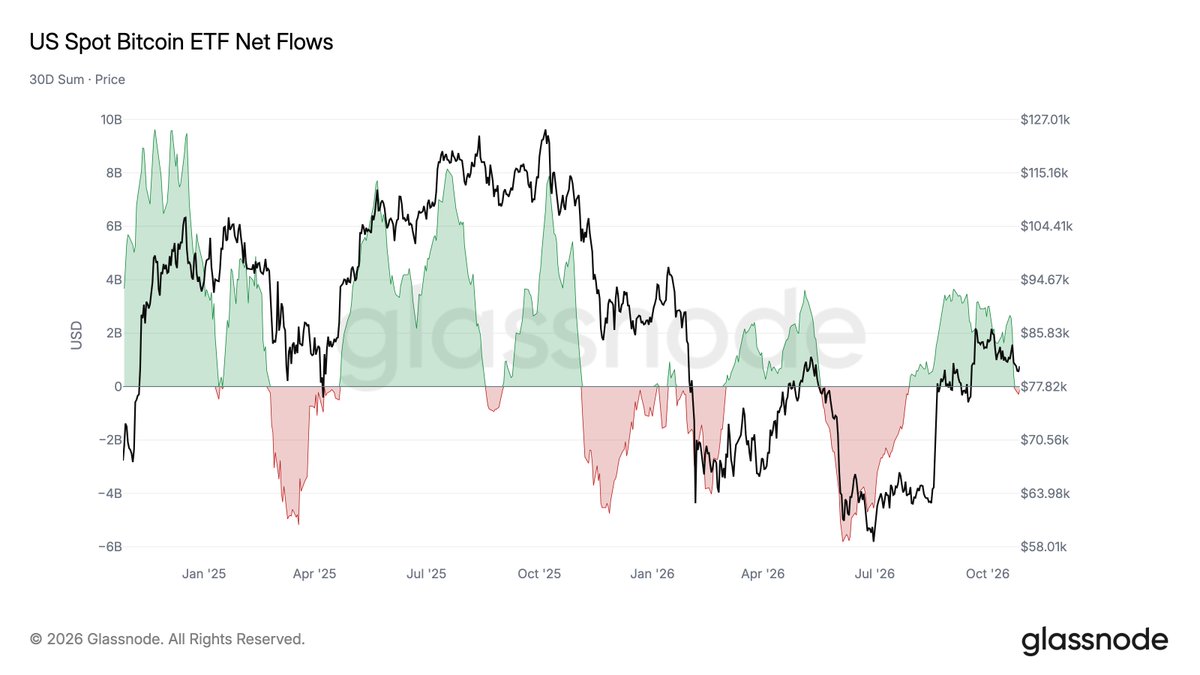
US spot Bitcoin ETF inflows resume after a brief dip
US spot Bitcoin ETFs recorded net outflows over a rolling 30-day period for the first time since late July, reaching -$292 million on October 26.
Unlike the deep redemption cycles seen earlier this spring and summer, this pullback remained very shallow. Positive inflows have already returned this week, signaling that underlying institutional demand for Bitcoin remains resilient.
03
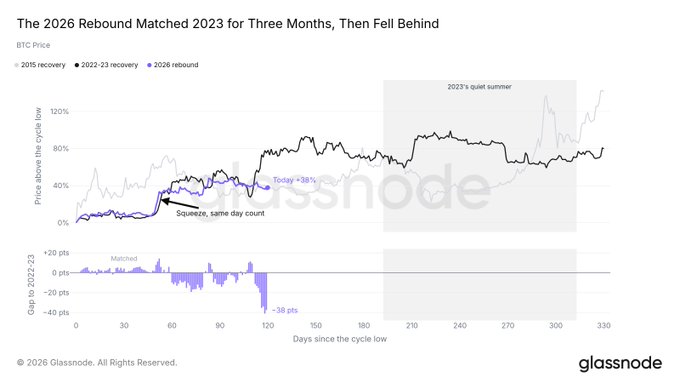
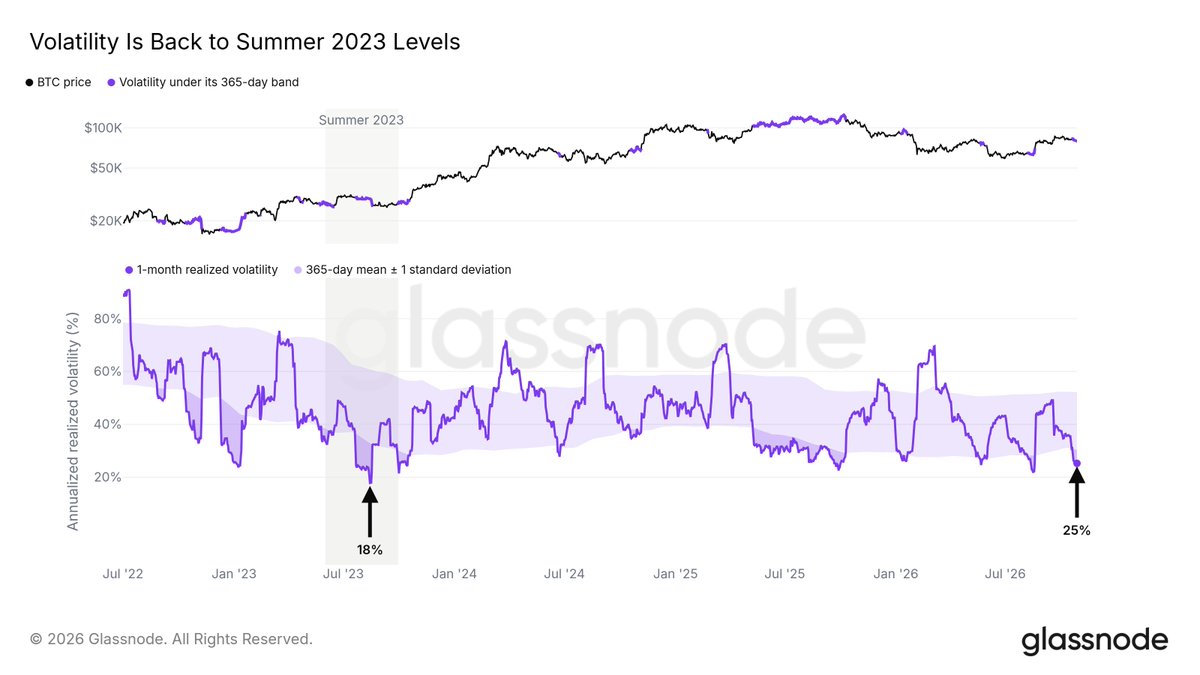
Bitcoin mirrors the 2023 volatility lull while trailing in price gains
Bitcoin's market structure closely echoes the 2023 cycle, though recent price momentum has cooled. For the first three months off the June low, the 2026 rebound tracked the 2022-2023 recovery almost day for day, featuring an identical short squeeze around day 50 followed by an altcoin flurry and collapsing volatility.
One-month realized volatility has now compressed to 25%, nearing the 18% trough of summer 2023. However, price performance has fallen behind: Bitcoin sits 38% above its cycle low compared to 75% at the same stage in 2023. The market has entered a familiar quiet phase, but with a much smaller price gain off the bottom
03
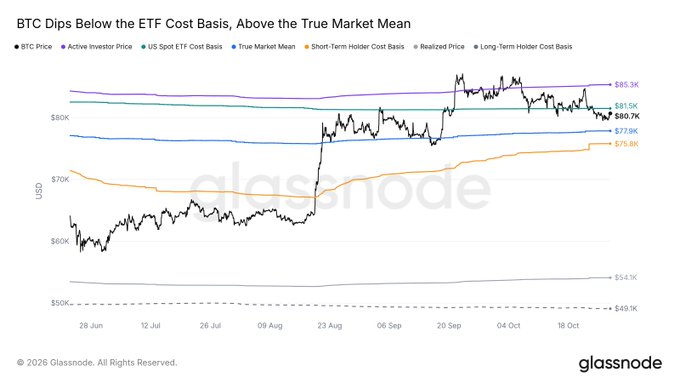
Bitcoin trades just below the US spot ETF average cost basis
Bitcoin has slipped slightly below the US spot ETF cost basis at $81,500, which represents the average acquisition price paid by ETF buyers. Directly underneath sits the True Market Mean at $77,900, the average cost basis of active investors, which held firm during both October pullbacks.
Meanwhile, the average price paid by newer market entrants (Short-Term Holder Cost Basis) rests lower at $75,800. A daily close back above $81,500 would return the average ETF holder into profitable territory.
04
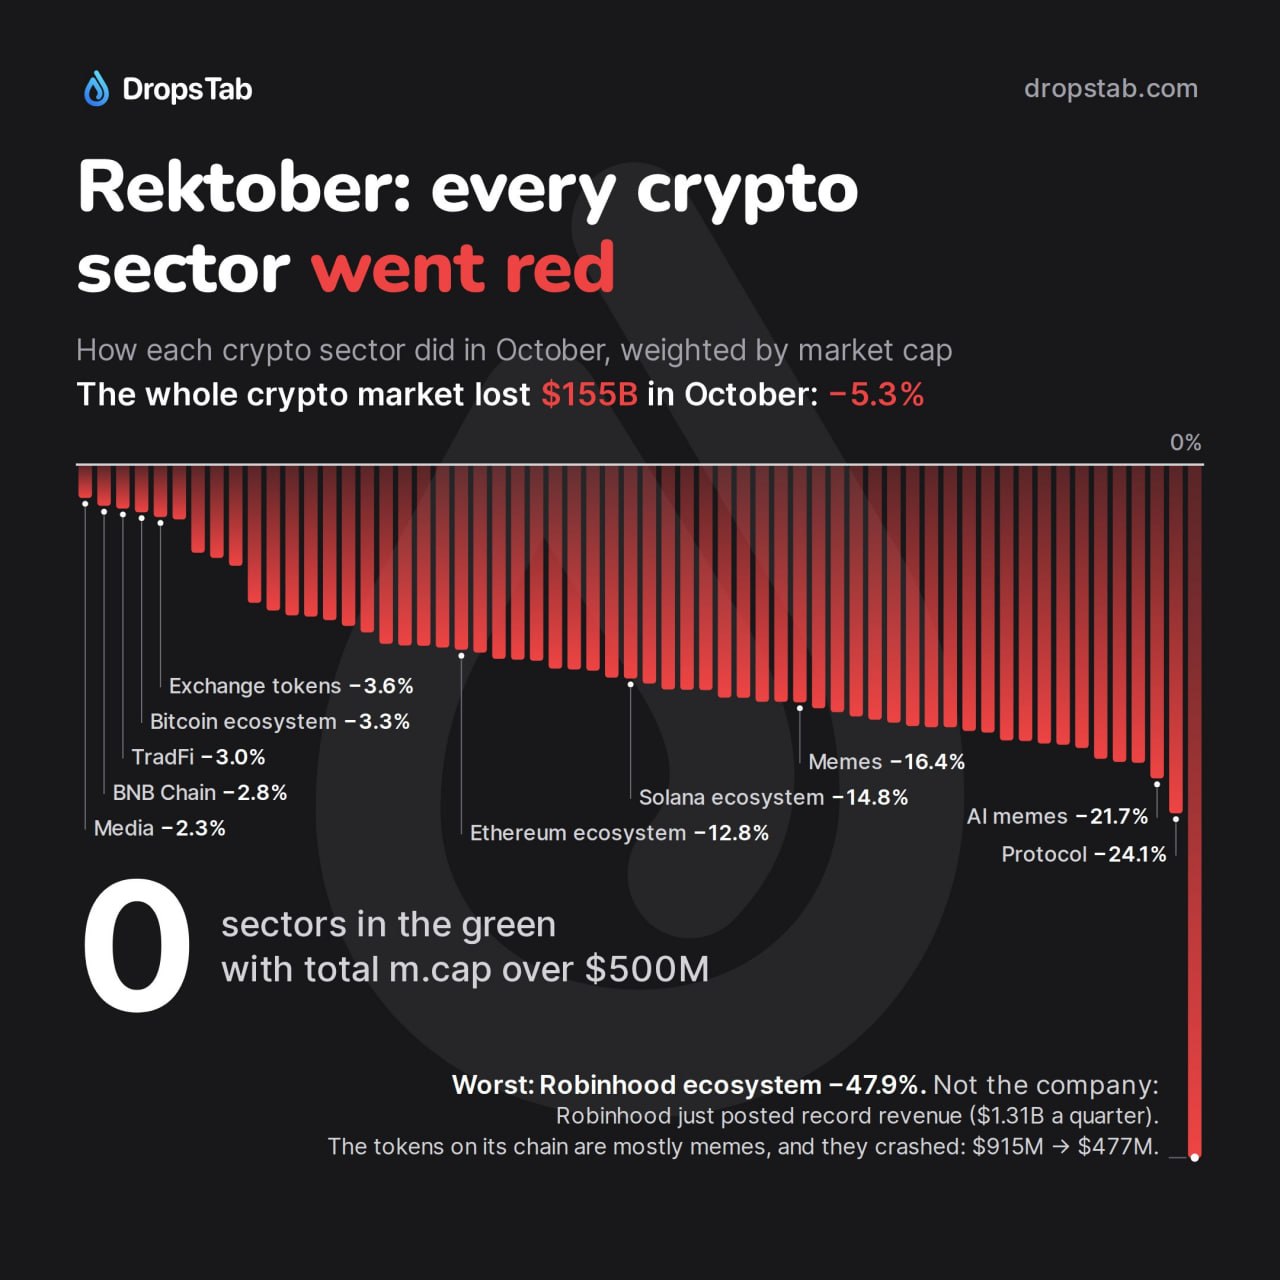
October disappoints crypto investors as US demand stays muted and all sectors slide
October has proven challenging across digital assets, with total crypto market capitalization shrinking by $155 billion (-5.3%) . Every major sector is trading in the red this month: Bitcoin is down roughly 4%, the Ethereum and Solana ecosystems have dropped 13-15%, and higher-risk meme and AI tokens have slumped 16-22%.
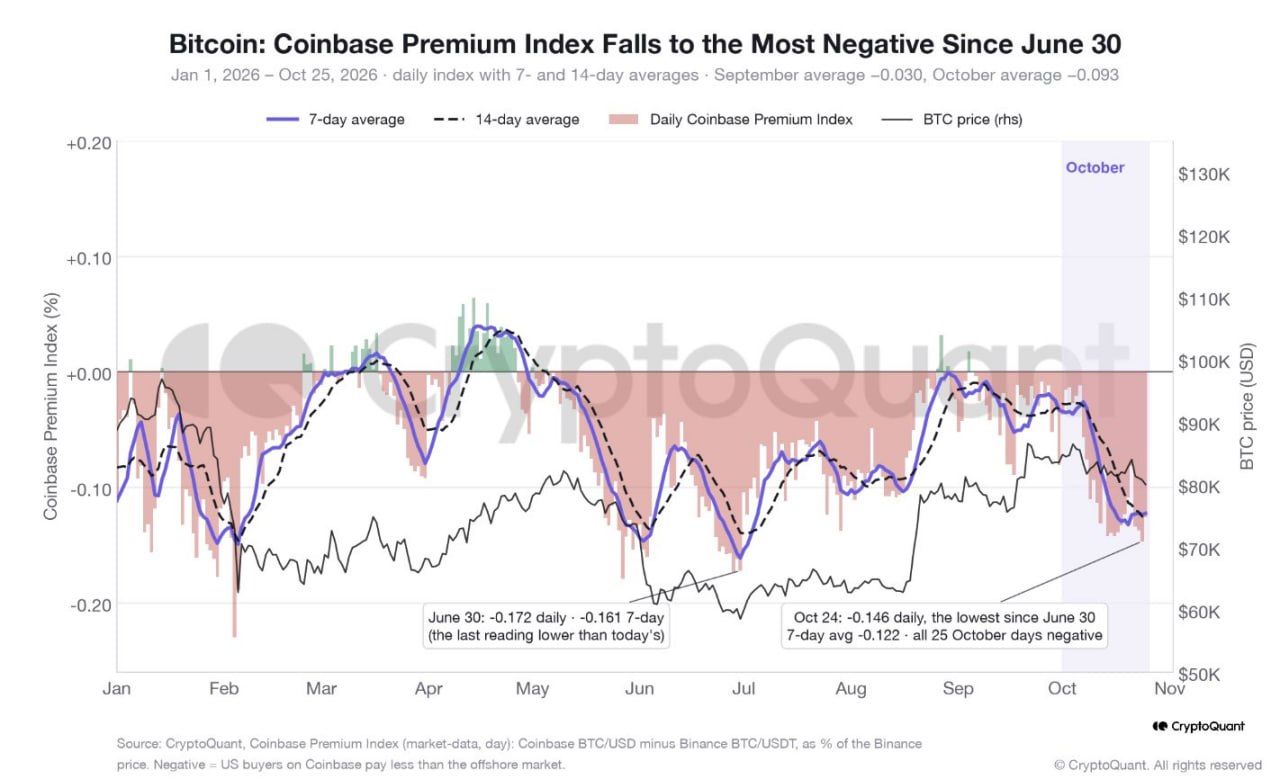
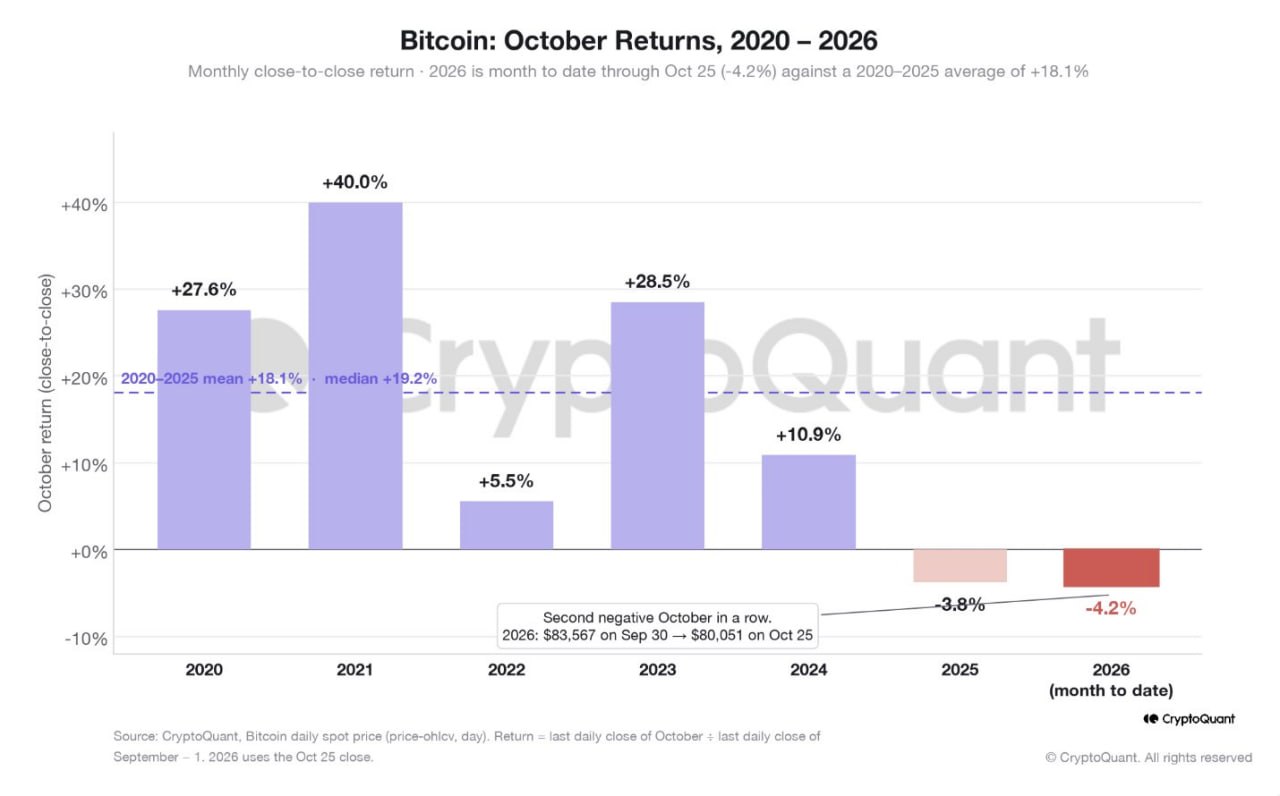
Lackluster demand from US buyers has been a primary drag on the market. The Coinbase Premium Index (measuring the price gap between Bitcoin on Coinbase versus offshore exchanges) has remained negative on every single day in October, reaching its deepest discount since June 30. With US investors sitting on the sidelines, the historically bullish October trend continues to disappoint.
05
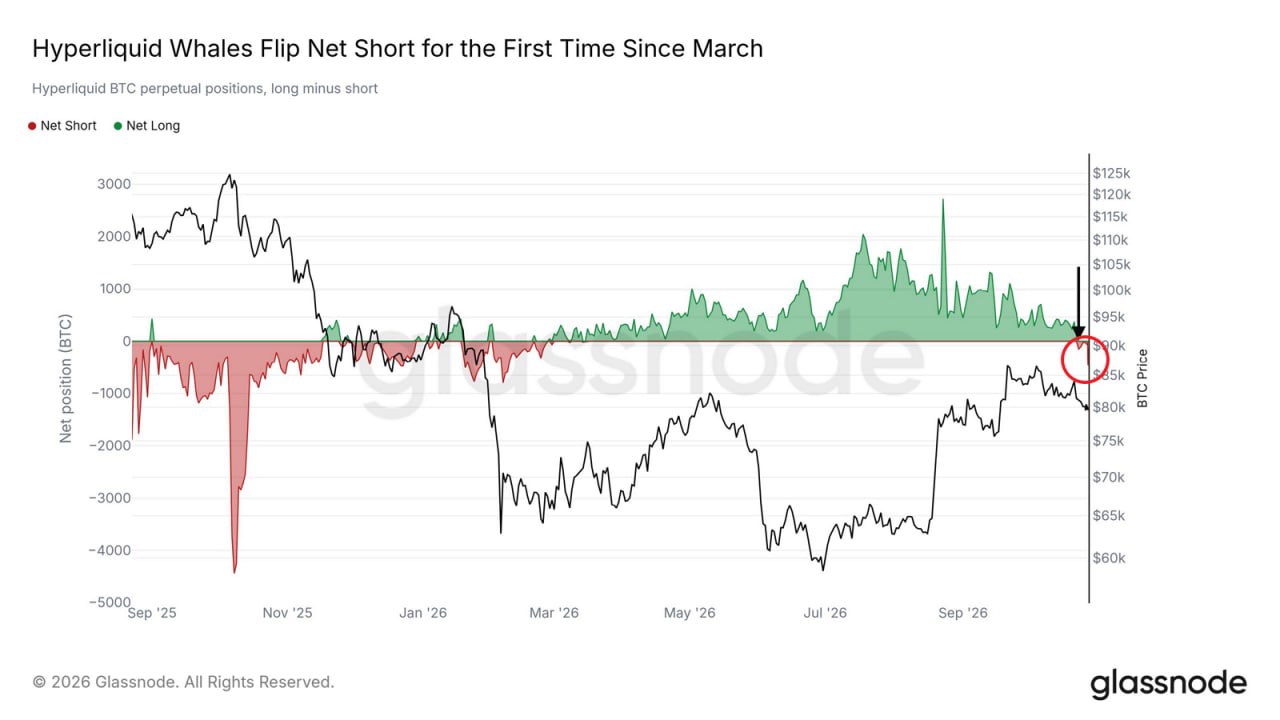
Hyperliquid whales flip net short on Bitcoin for the first time since March
Large traders on the decentralized exchange Hyperliquid have shifted into a net short position in Bitcoin perpetual futures for the first time since March. As prices pulled back toward $80,000, aggregate short exposure among major accounts overtook bullish bets.
Assuming Bitcoin remains within a broader bull market structure, this positioning shift has historically served as a contrarian bullish signal. When large speculators turn net bearish into weakness, it often marks local exhaustion and sets the stage for an upward short squeeze once momentum stabilizes.
06
BTC: Trend Structure and Our Expectations
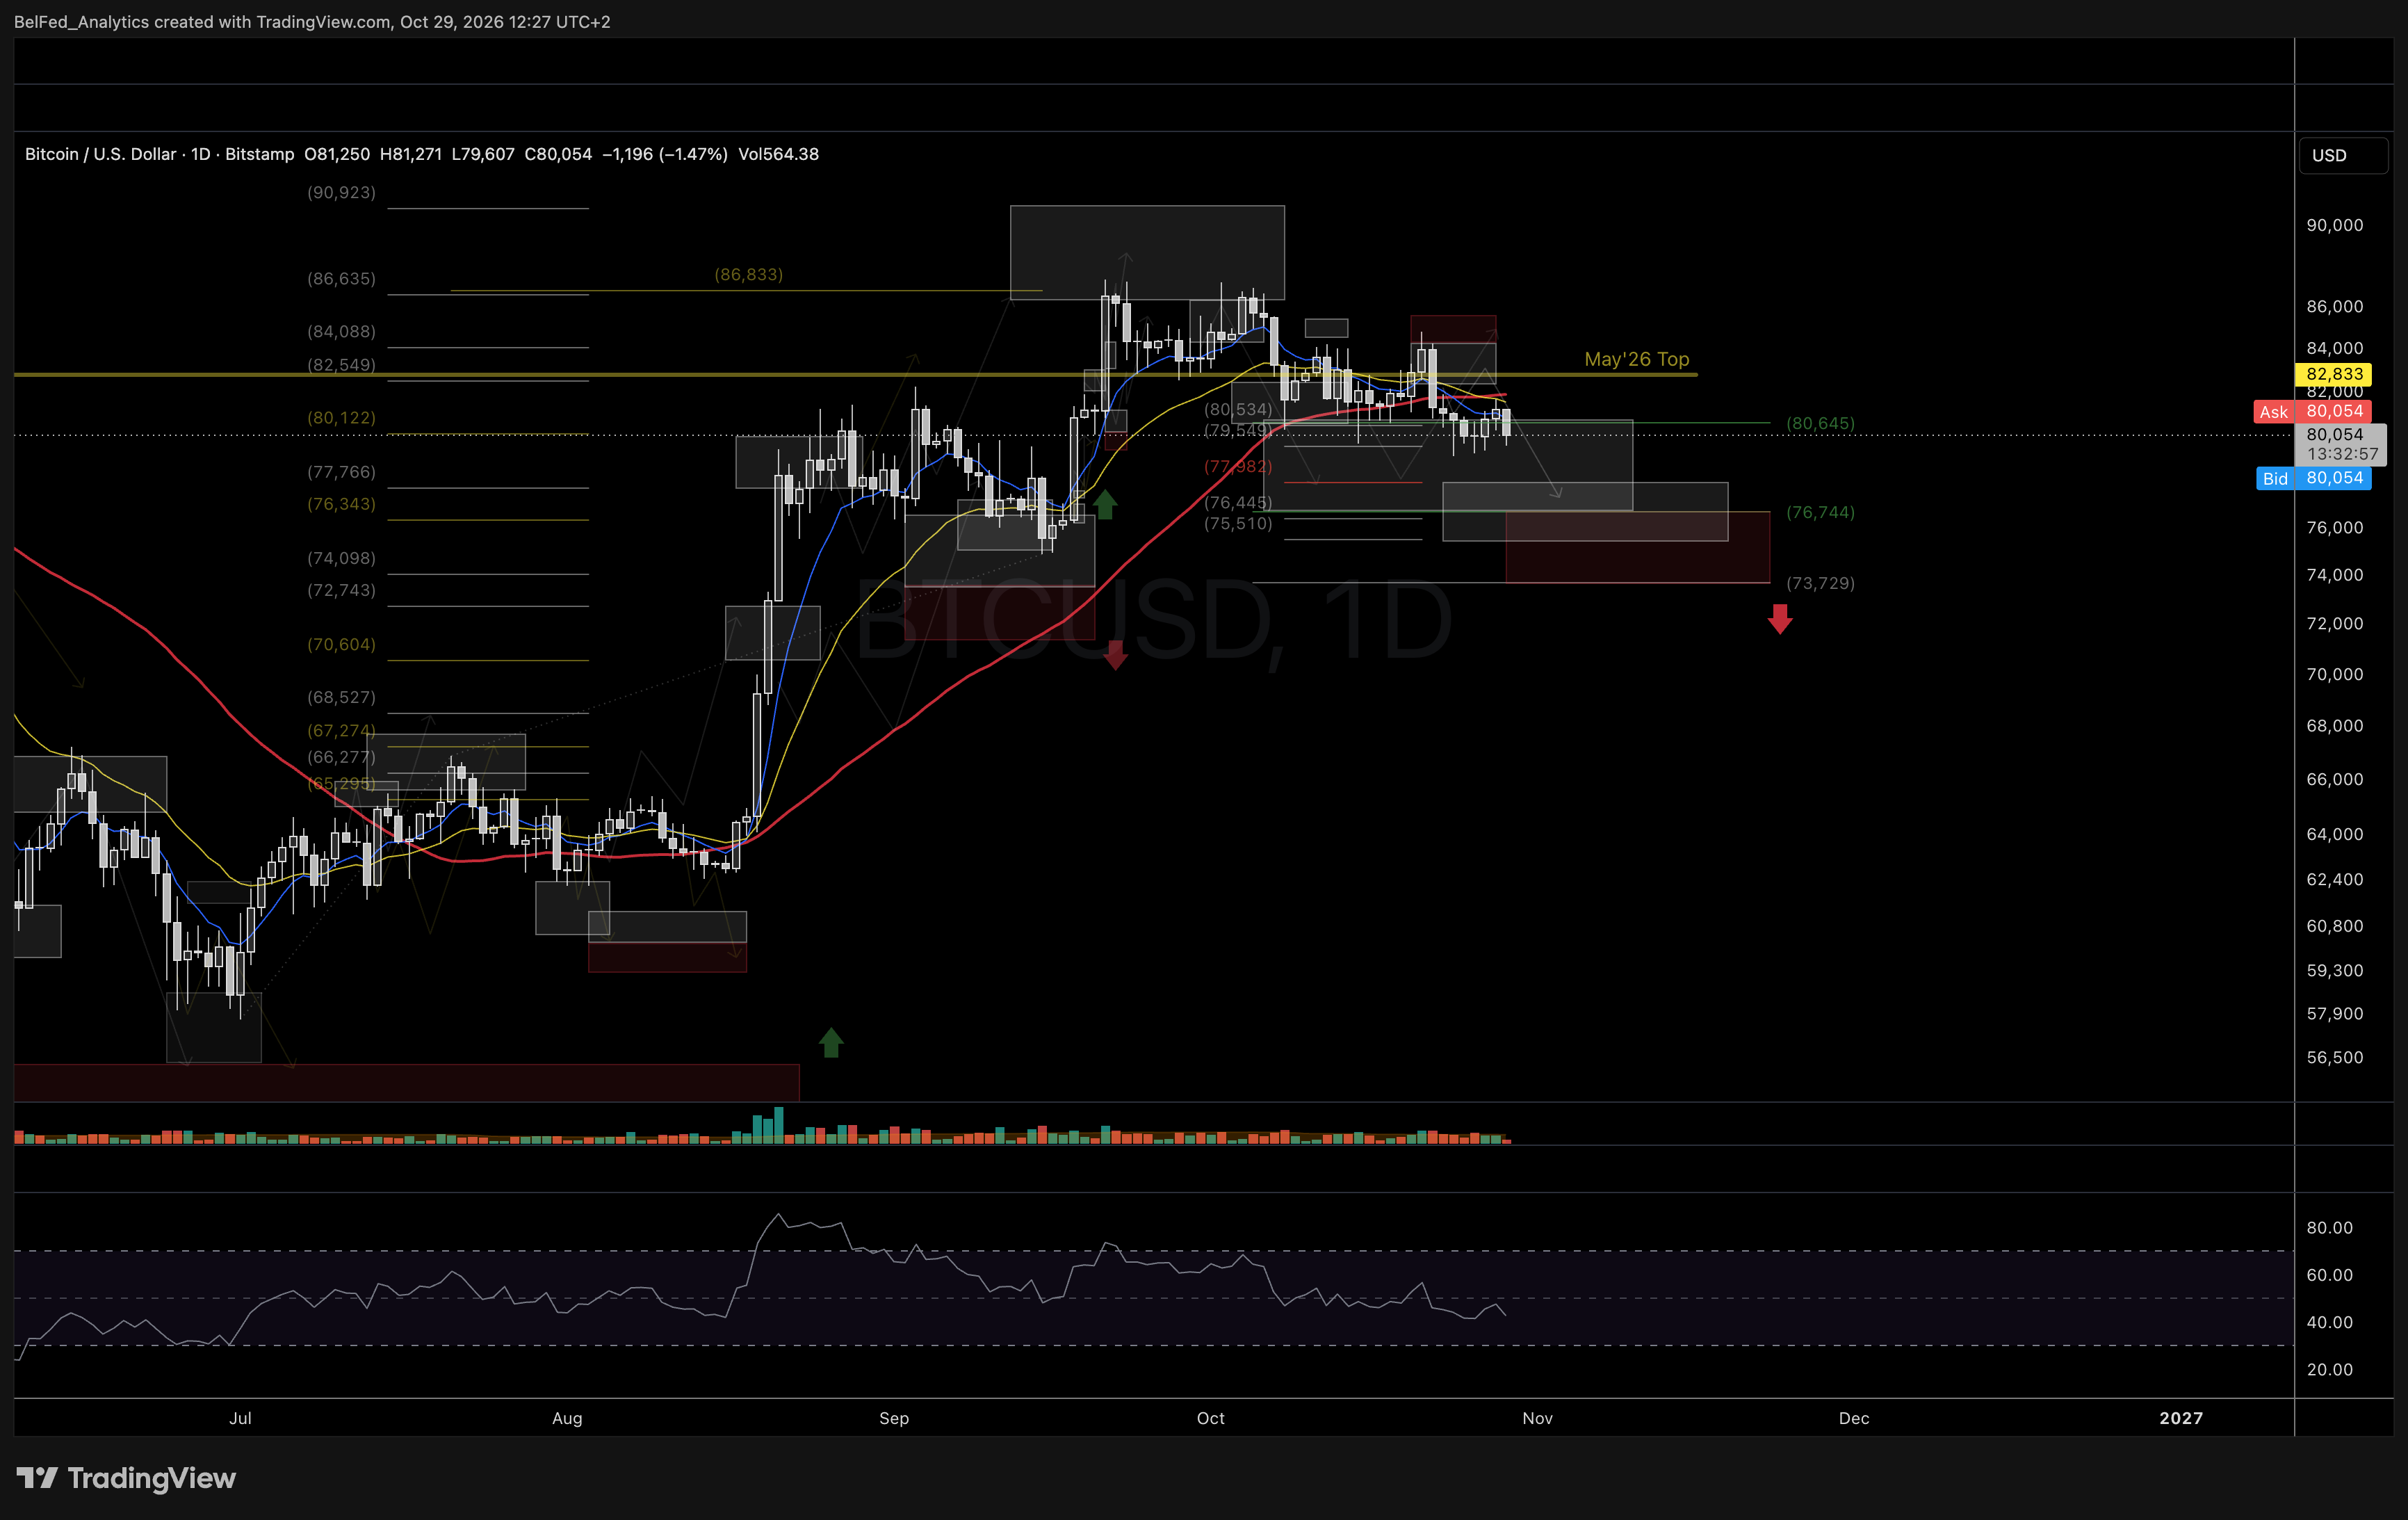
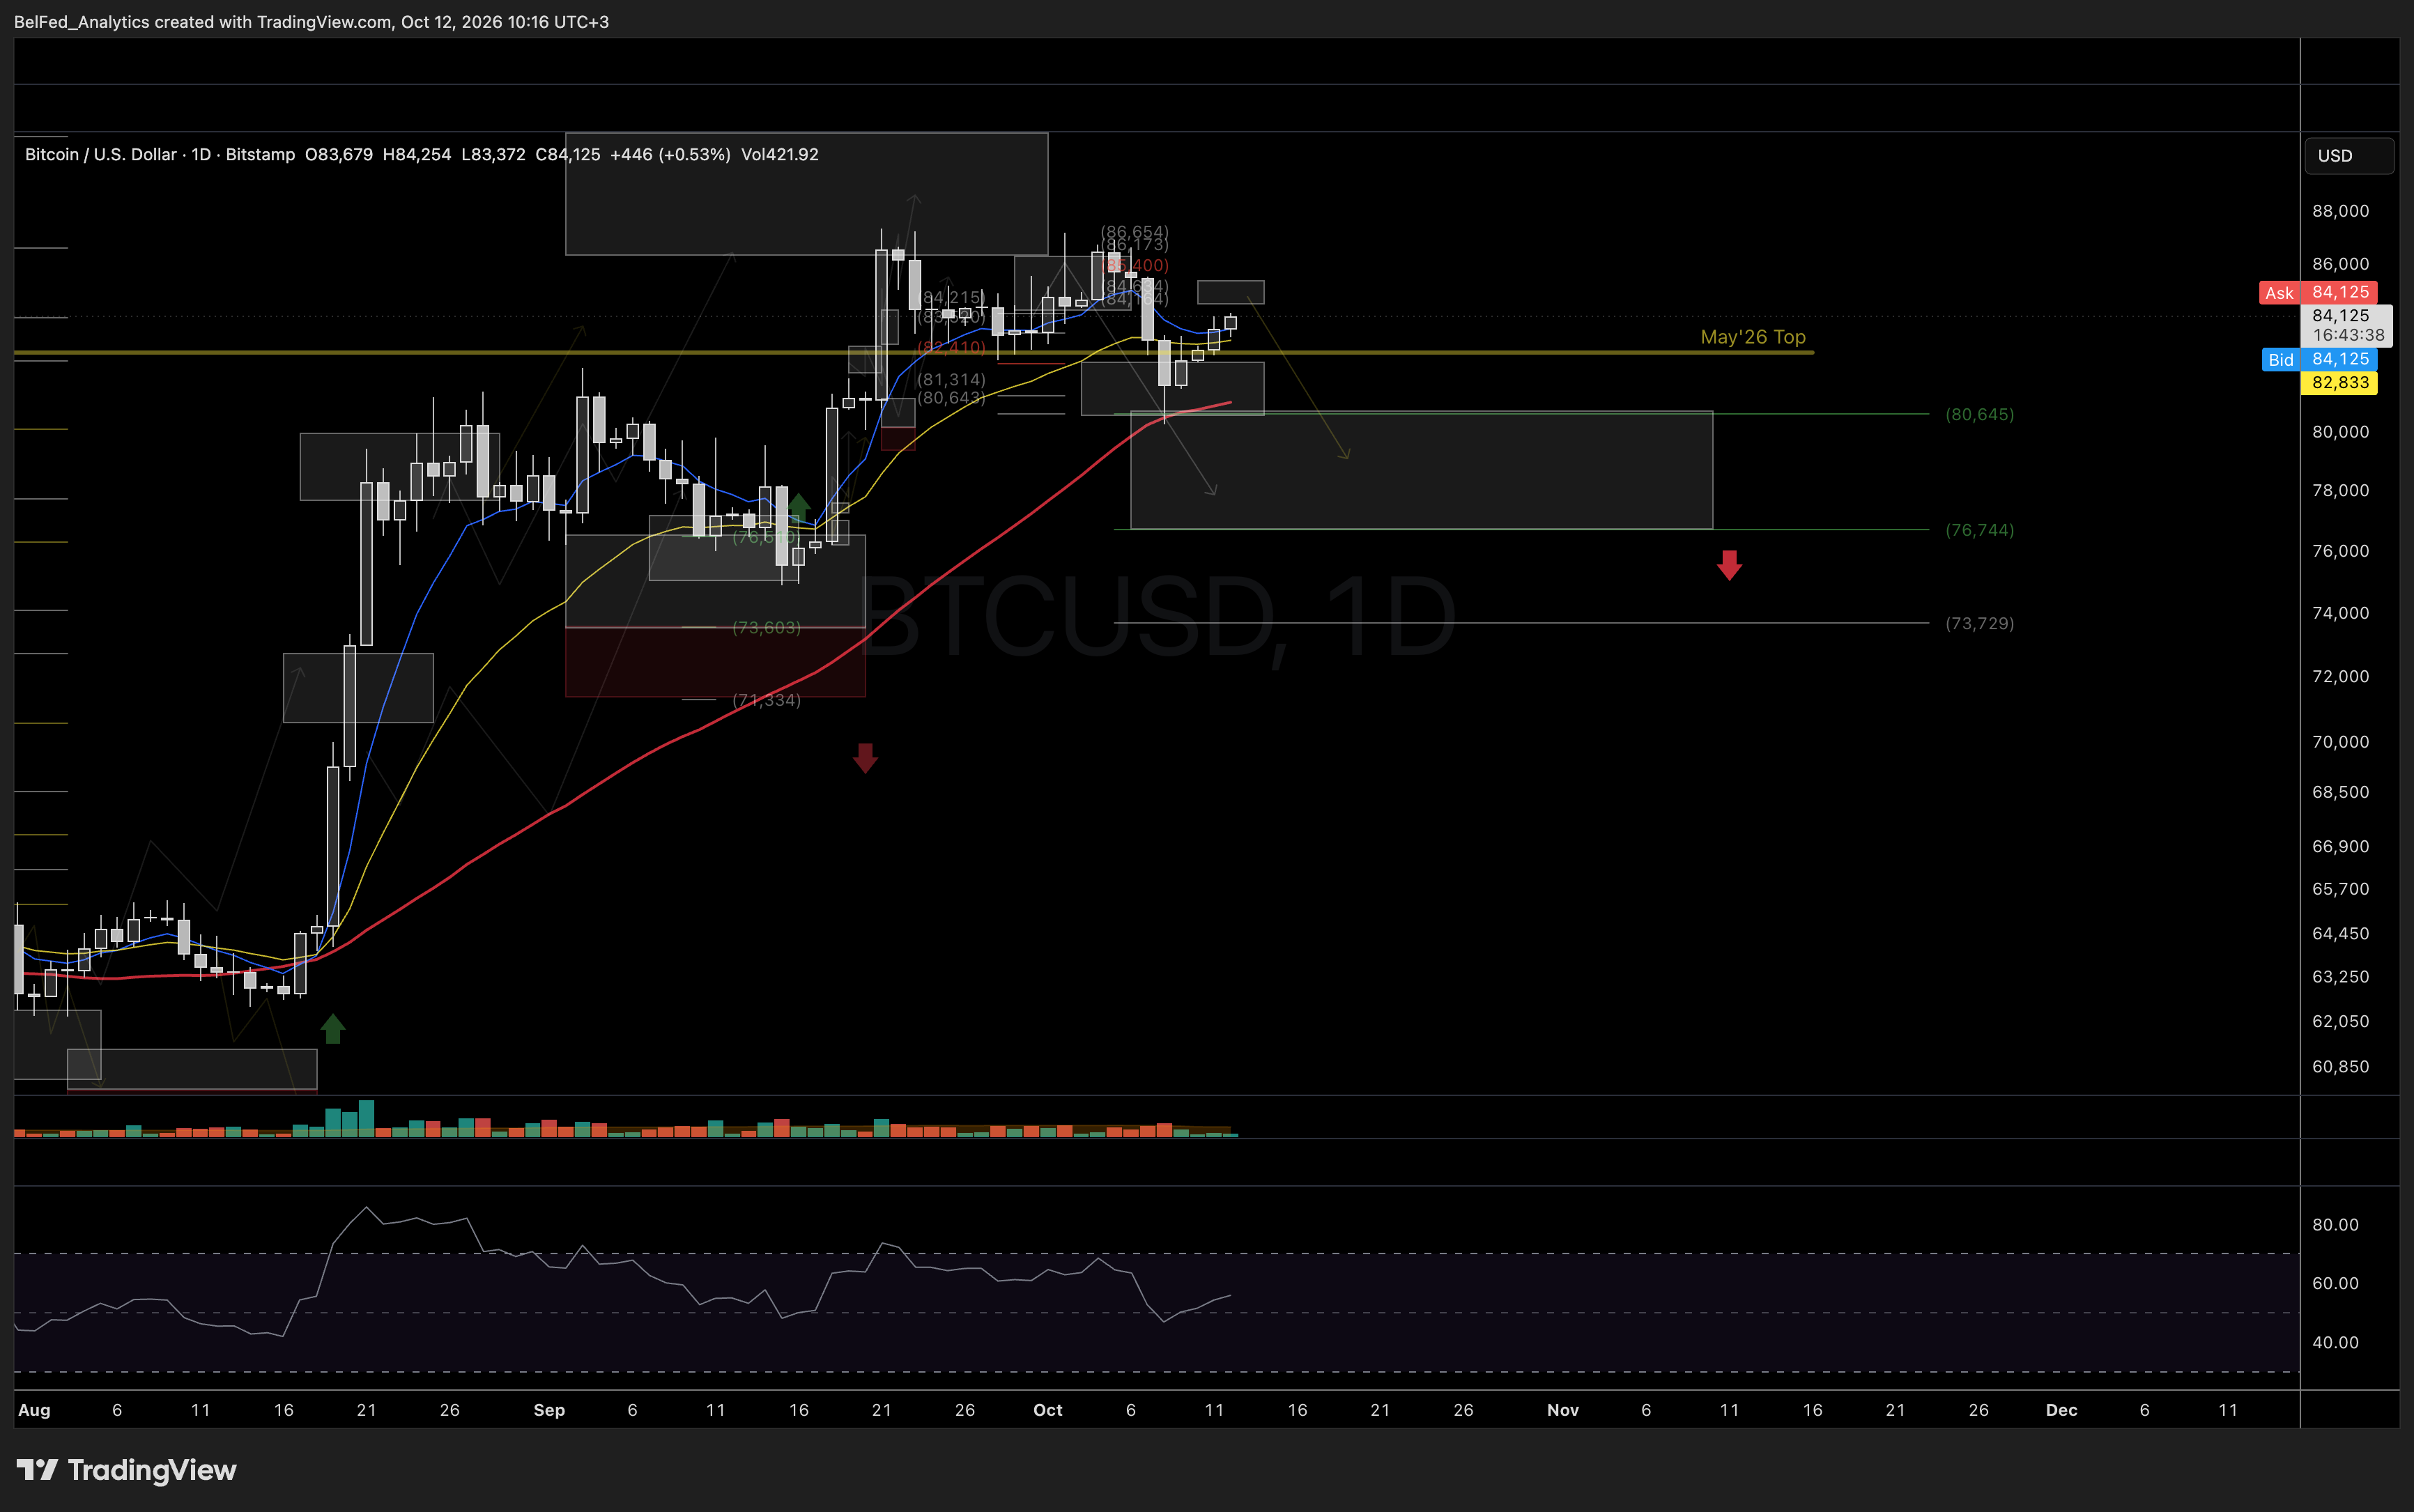
Price continues to follow the general structure we outlined in our September and October updates and is progressing with its consolidation within the medium-term support area at 81–77–74K.
We think price may be in the final stages of its pullback from the September high, though it could still attempt one more push lower to test the 78–76K levels before a bottom is established. As long as price closes below yesterday's high, we will keep this structure and scenario as our primary view.
If price reaches those deeper support levels in the coming week, we will look for signs of bottoming and potentially consider initiating new long exposure in the crypto sector.
07
ETH: Trend Structure and Our Expectations
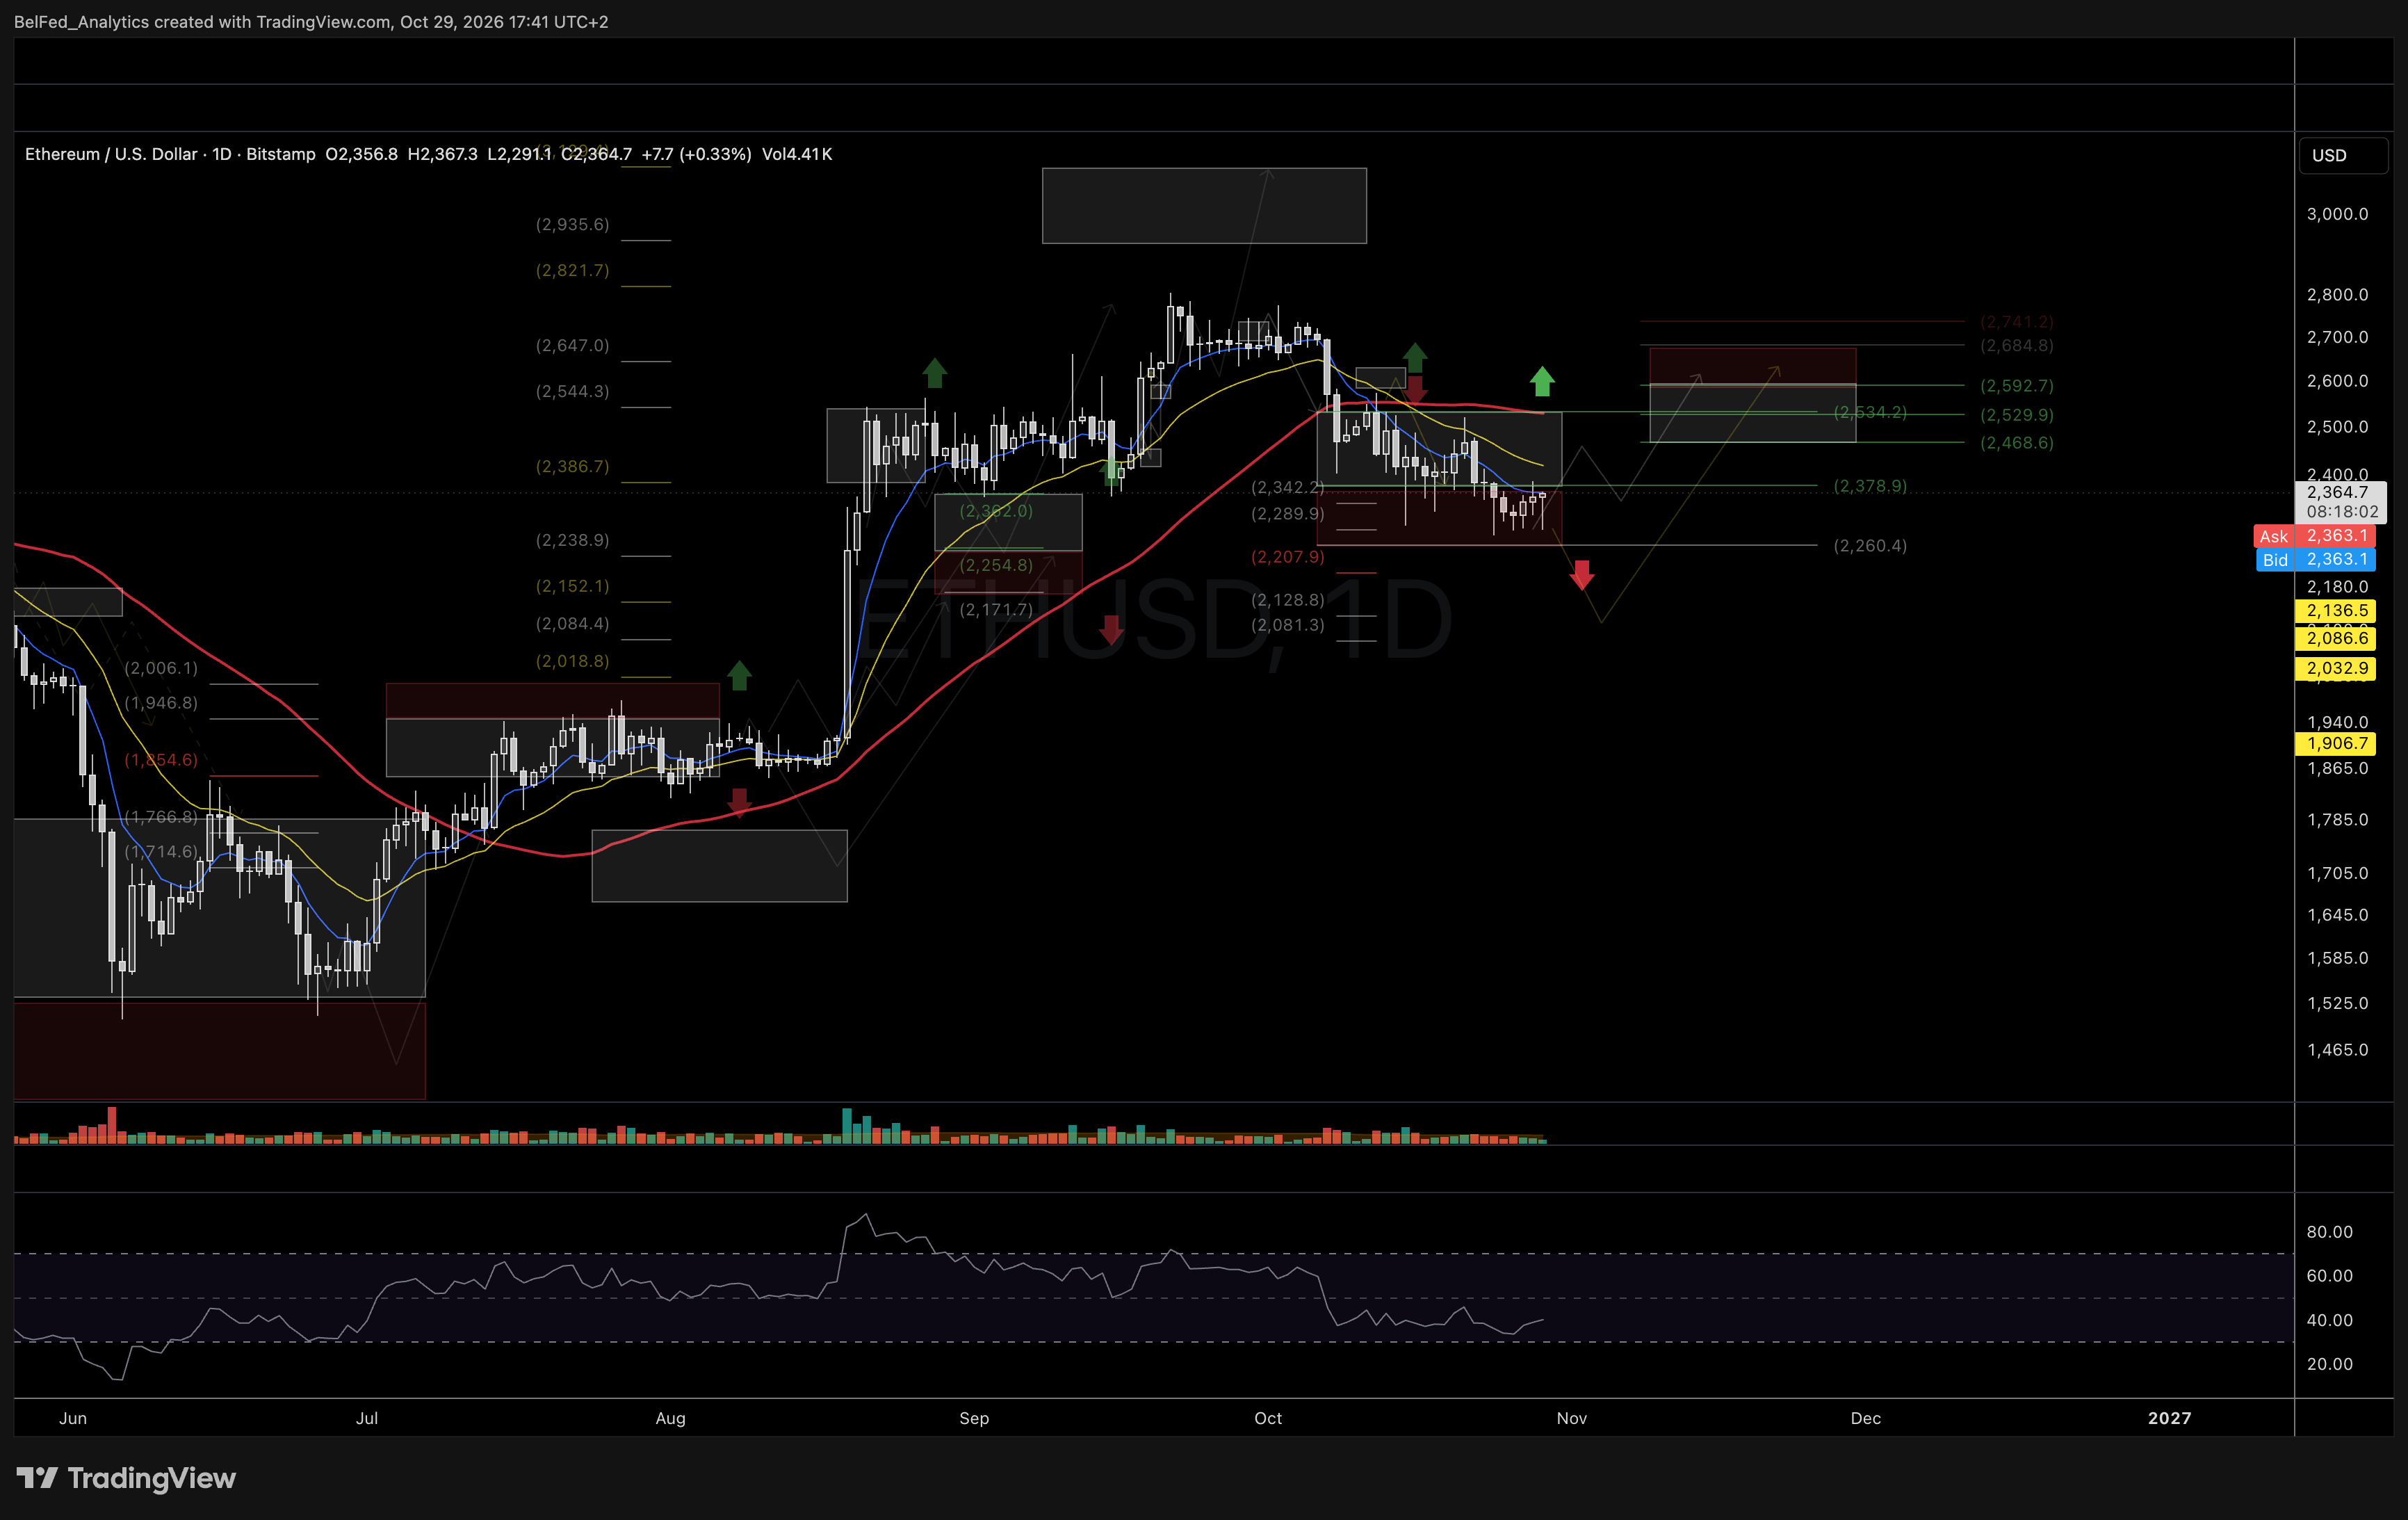
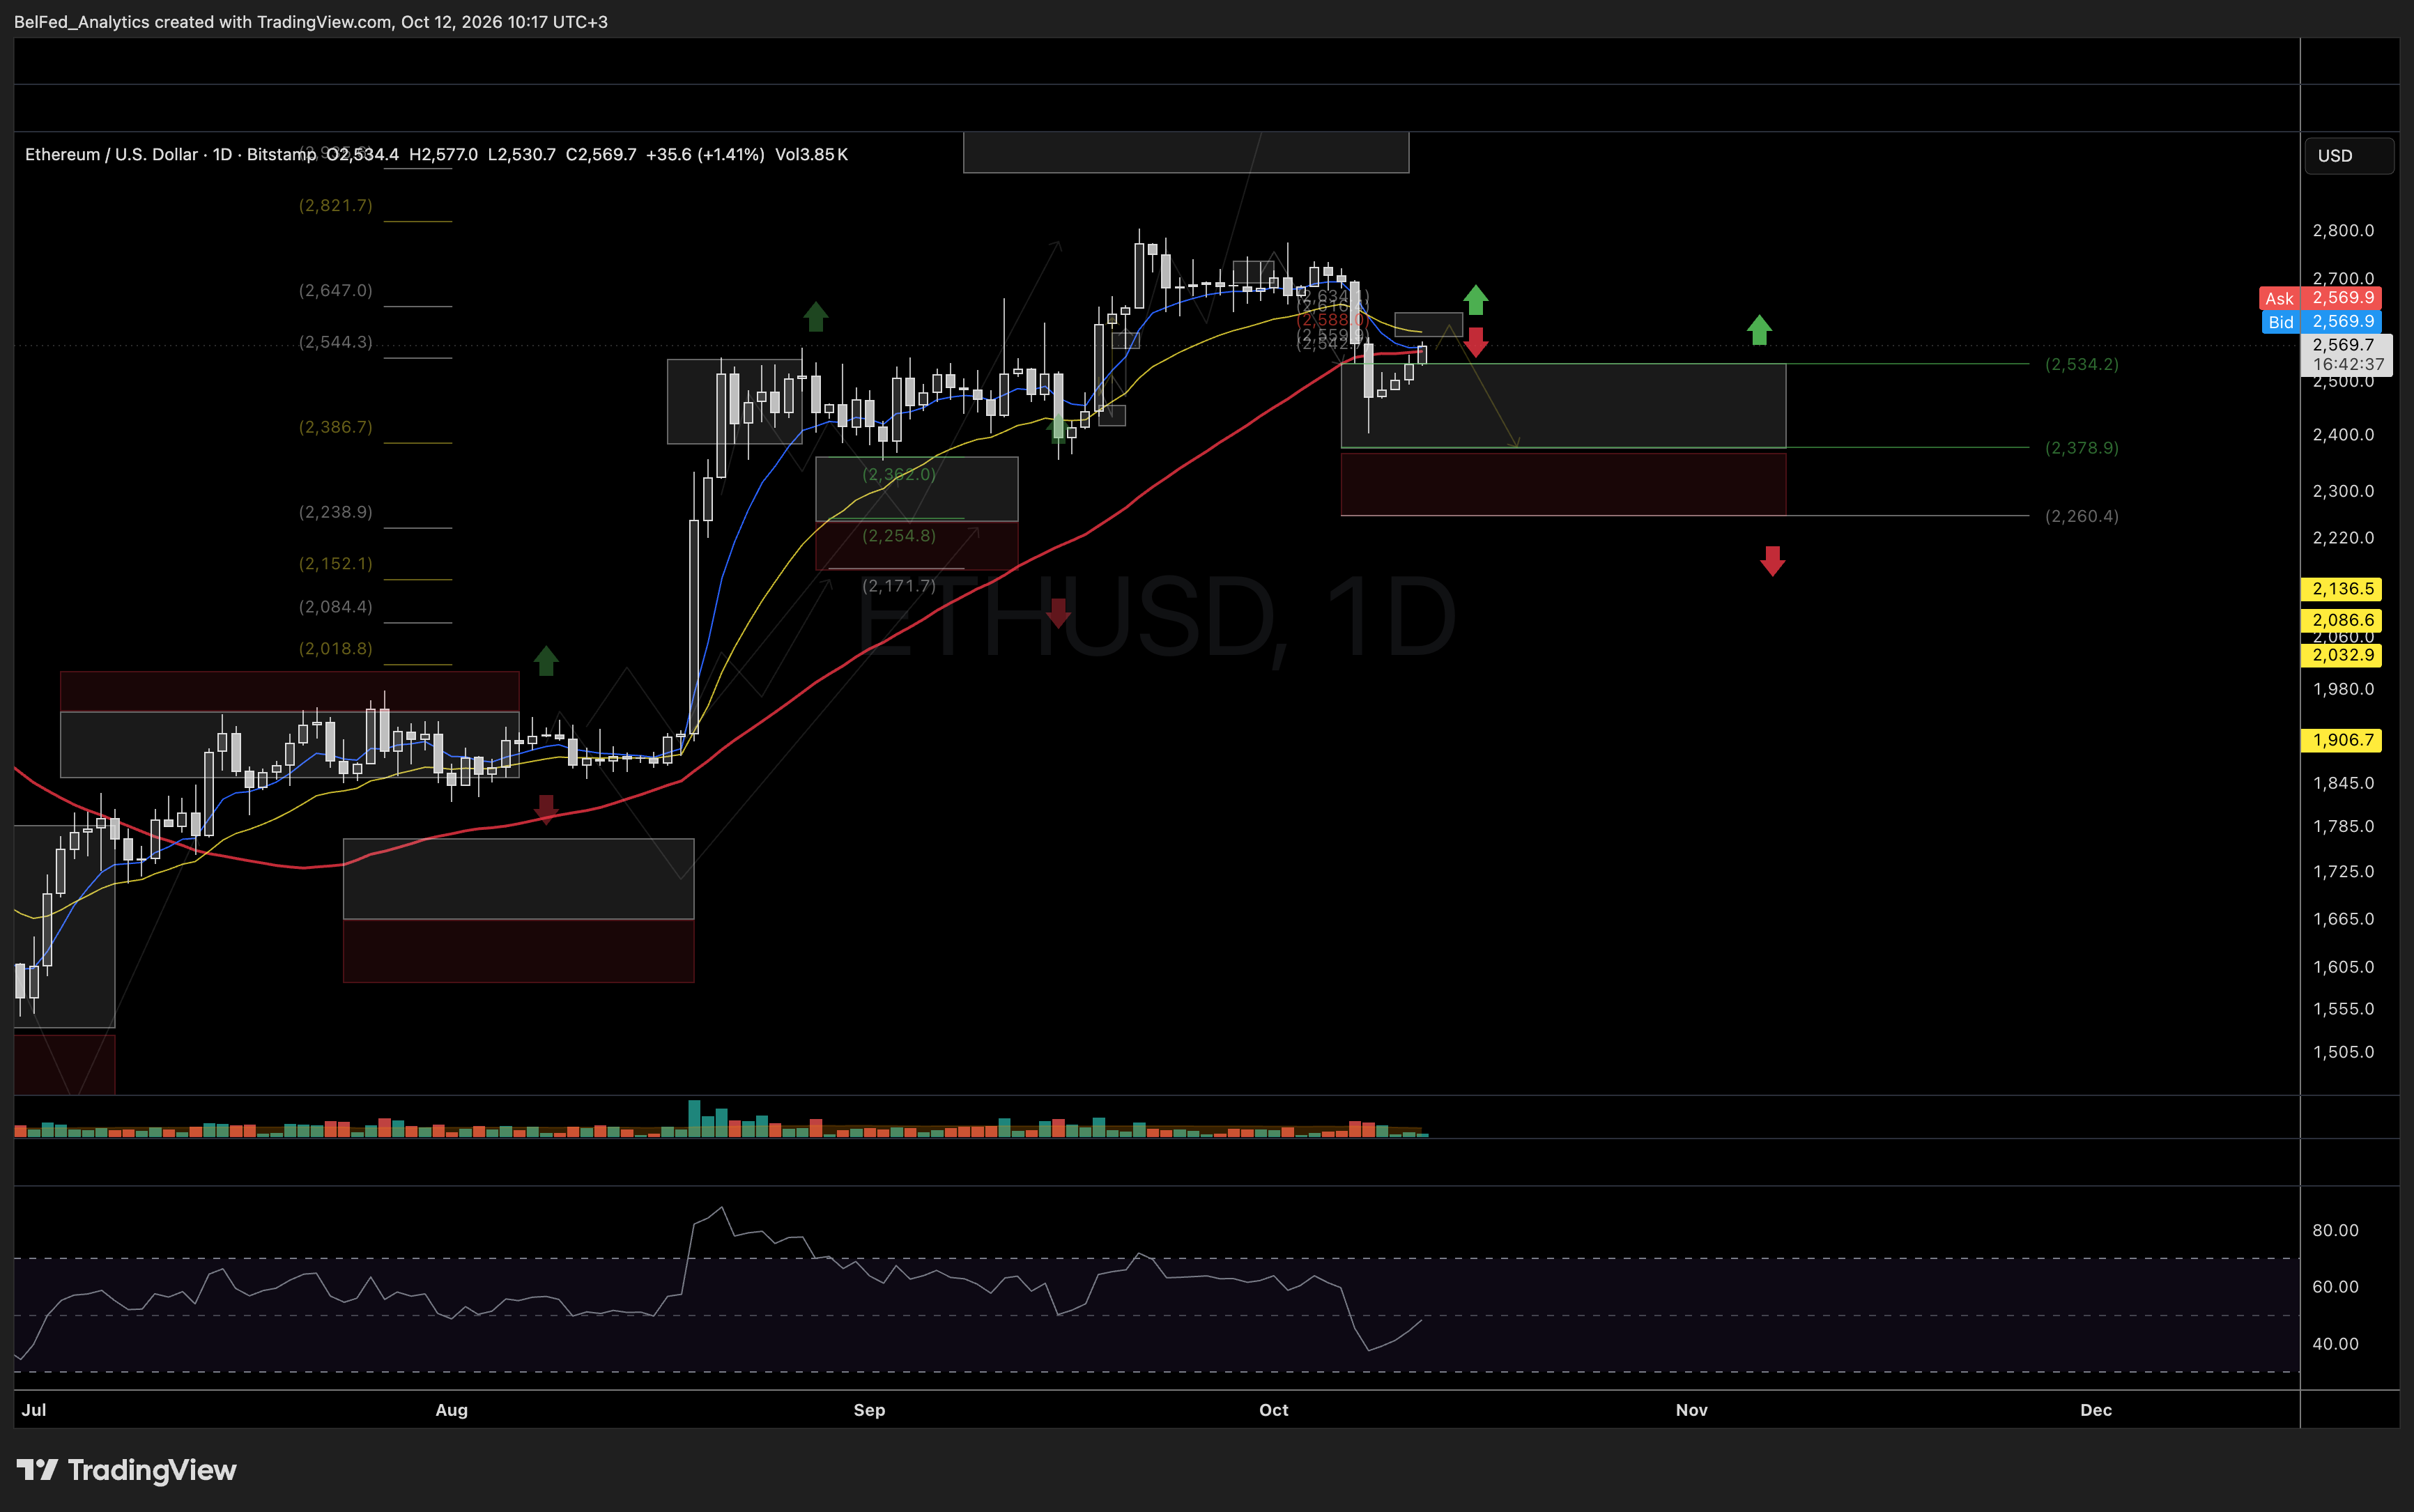
Price is still trying to build a base within the medium-term support zone we outlined in our previous analysis. If price manages to hold above 2260 in the coming days, we see higher odds of a recovery attempt to at least test the 2530 and 2600 resistance levels.
Alternatively, if price breaks down and starts closing below 2260, the odds will shift in favor of a deeper pullback that could test the 2130–2080 support levels before the corrective wave from the September high completes.
08
SOL: Trend Structure and Our Expectations
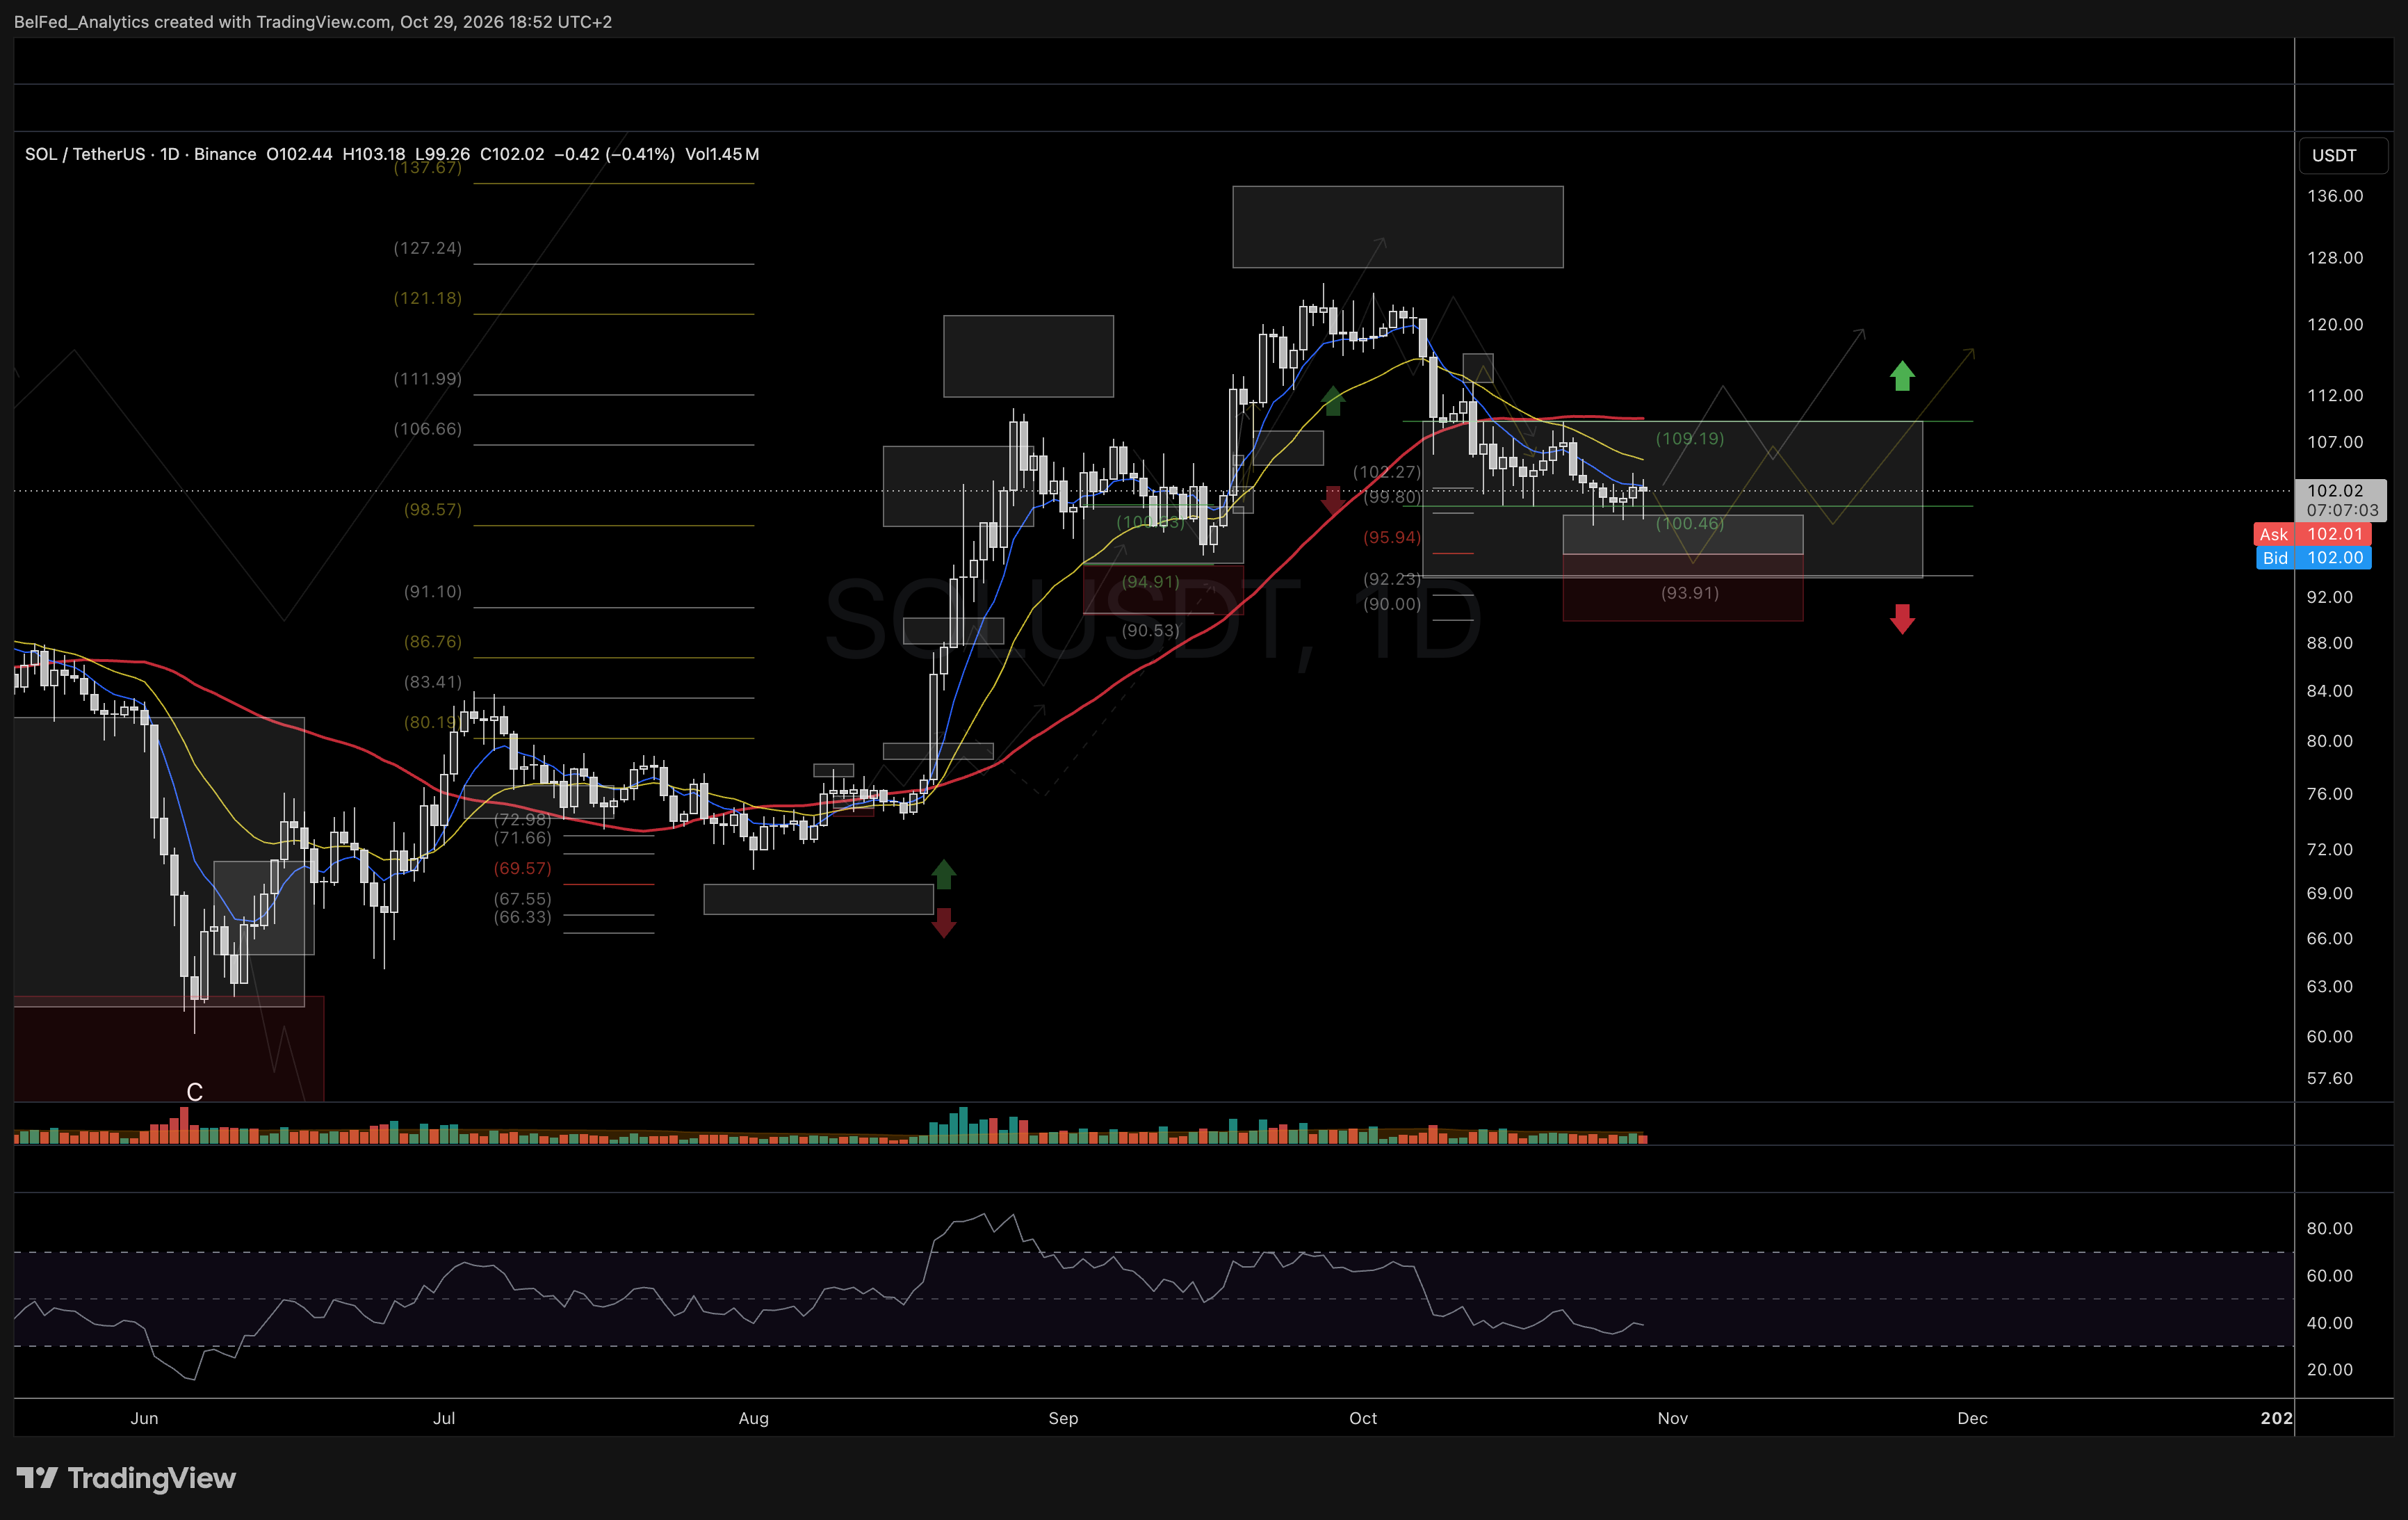
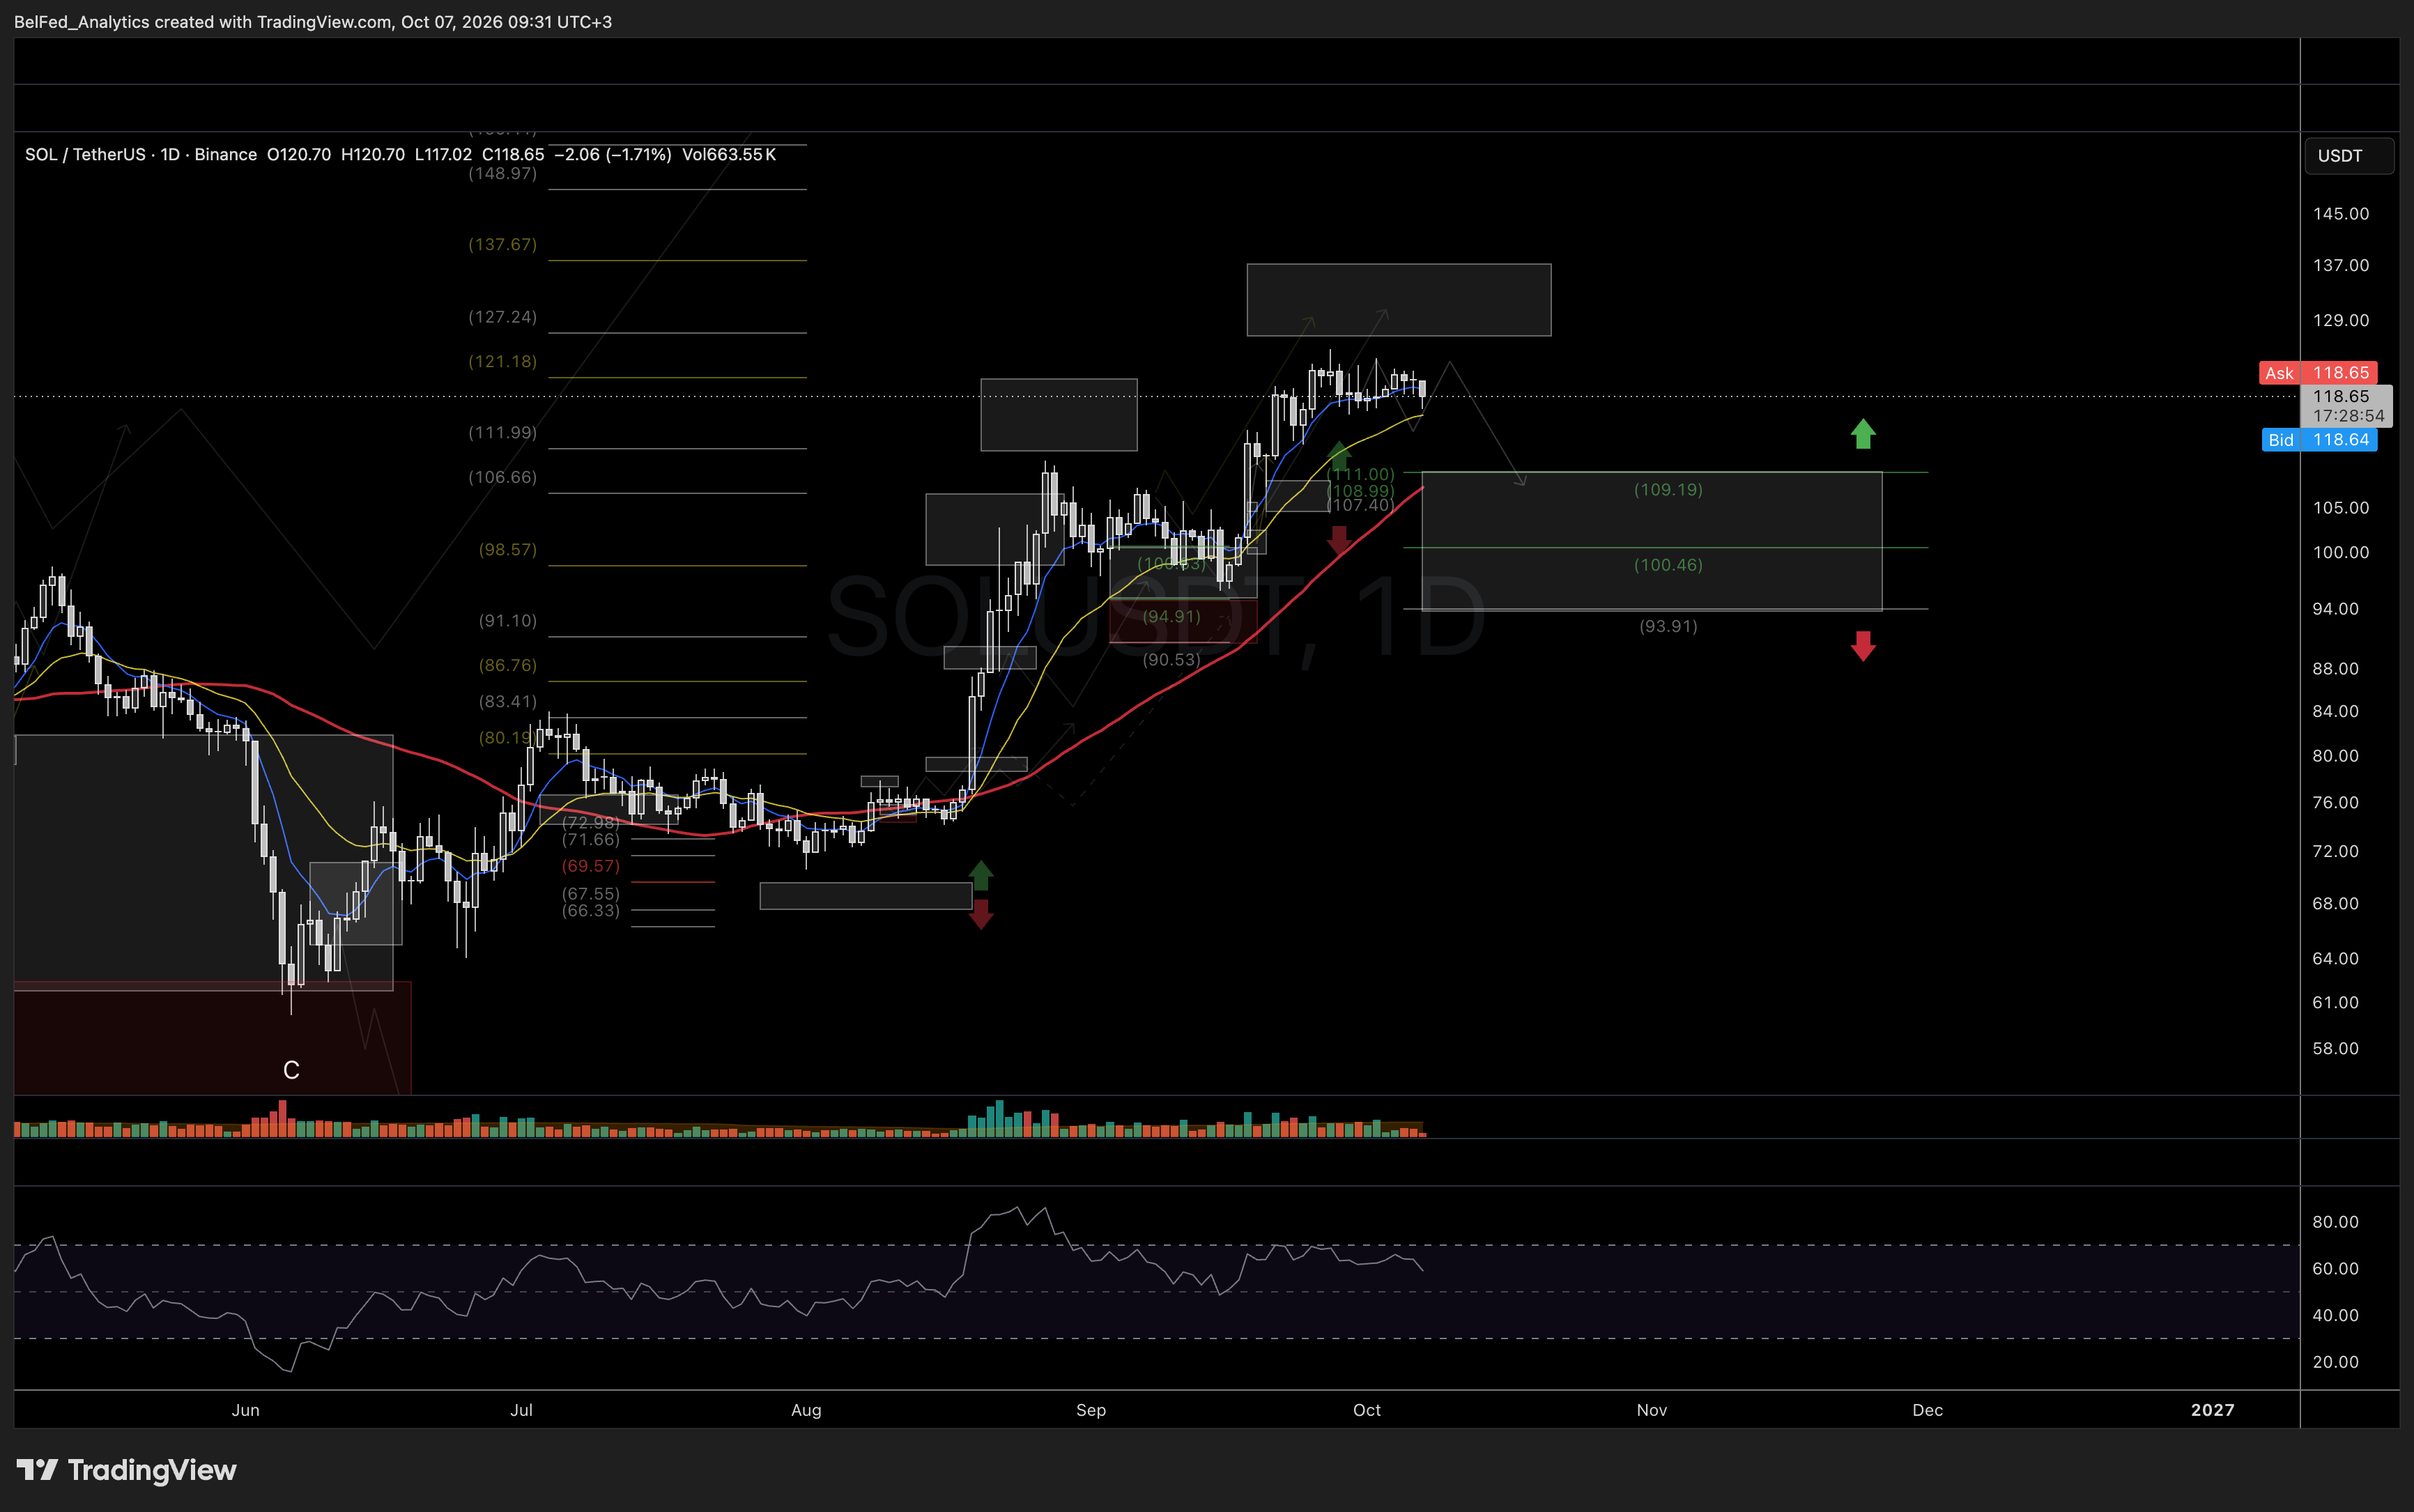
Price has followed our downside expectations from the early October update and has reached deeper medium-term support levels.
We cannot rule out one more attempt to test the lower support levels at 96–92/90, though we are eyeing a recovery attempt in the coming weeks that can target the 110–115 resistance zone.
09
XRP: Trend Structure and Our Expectations
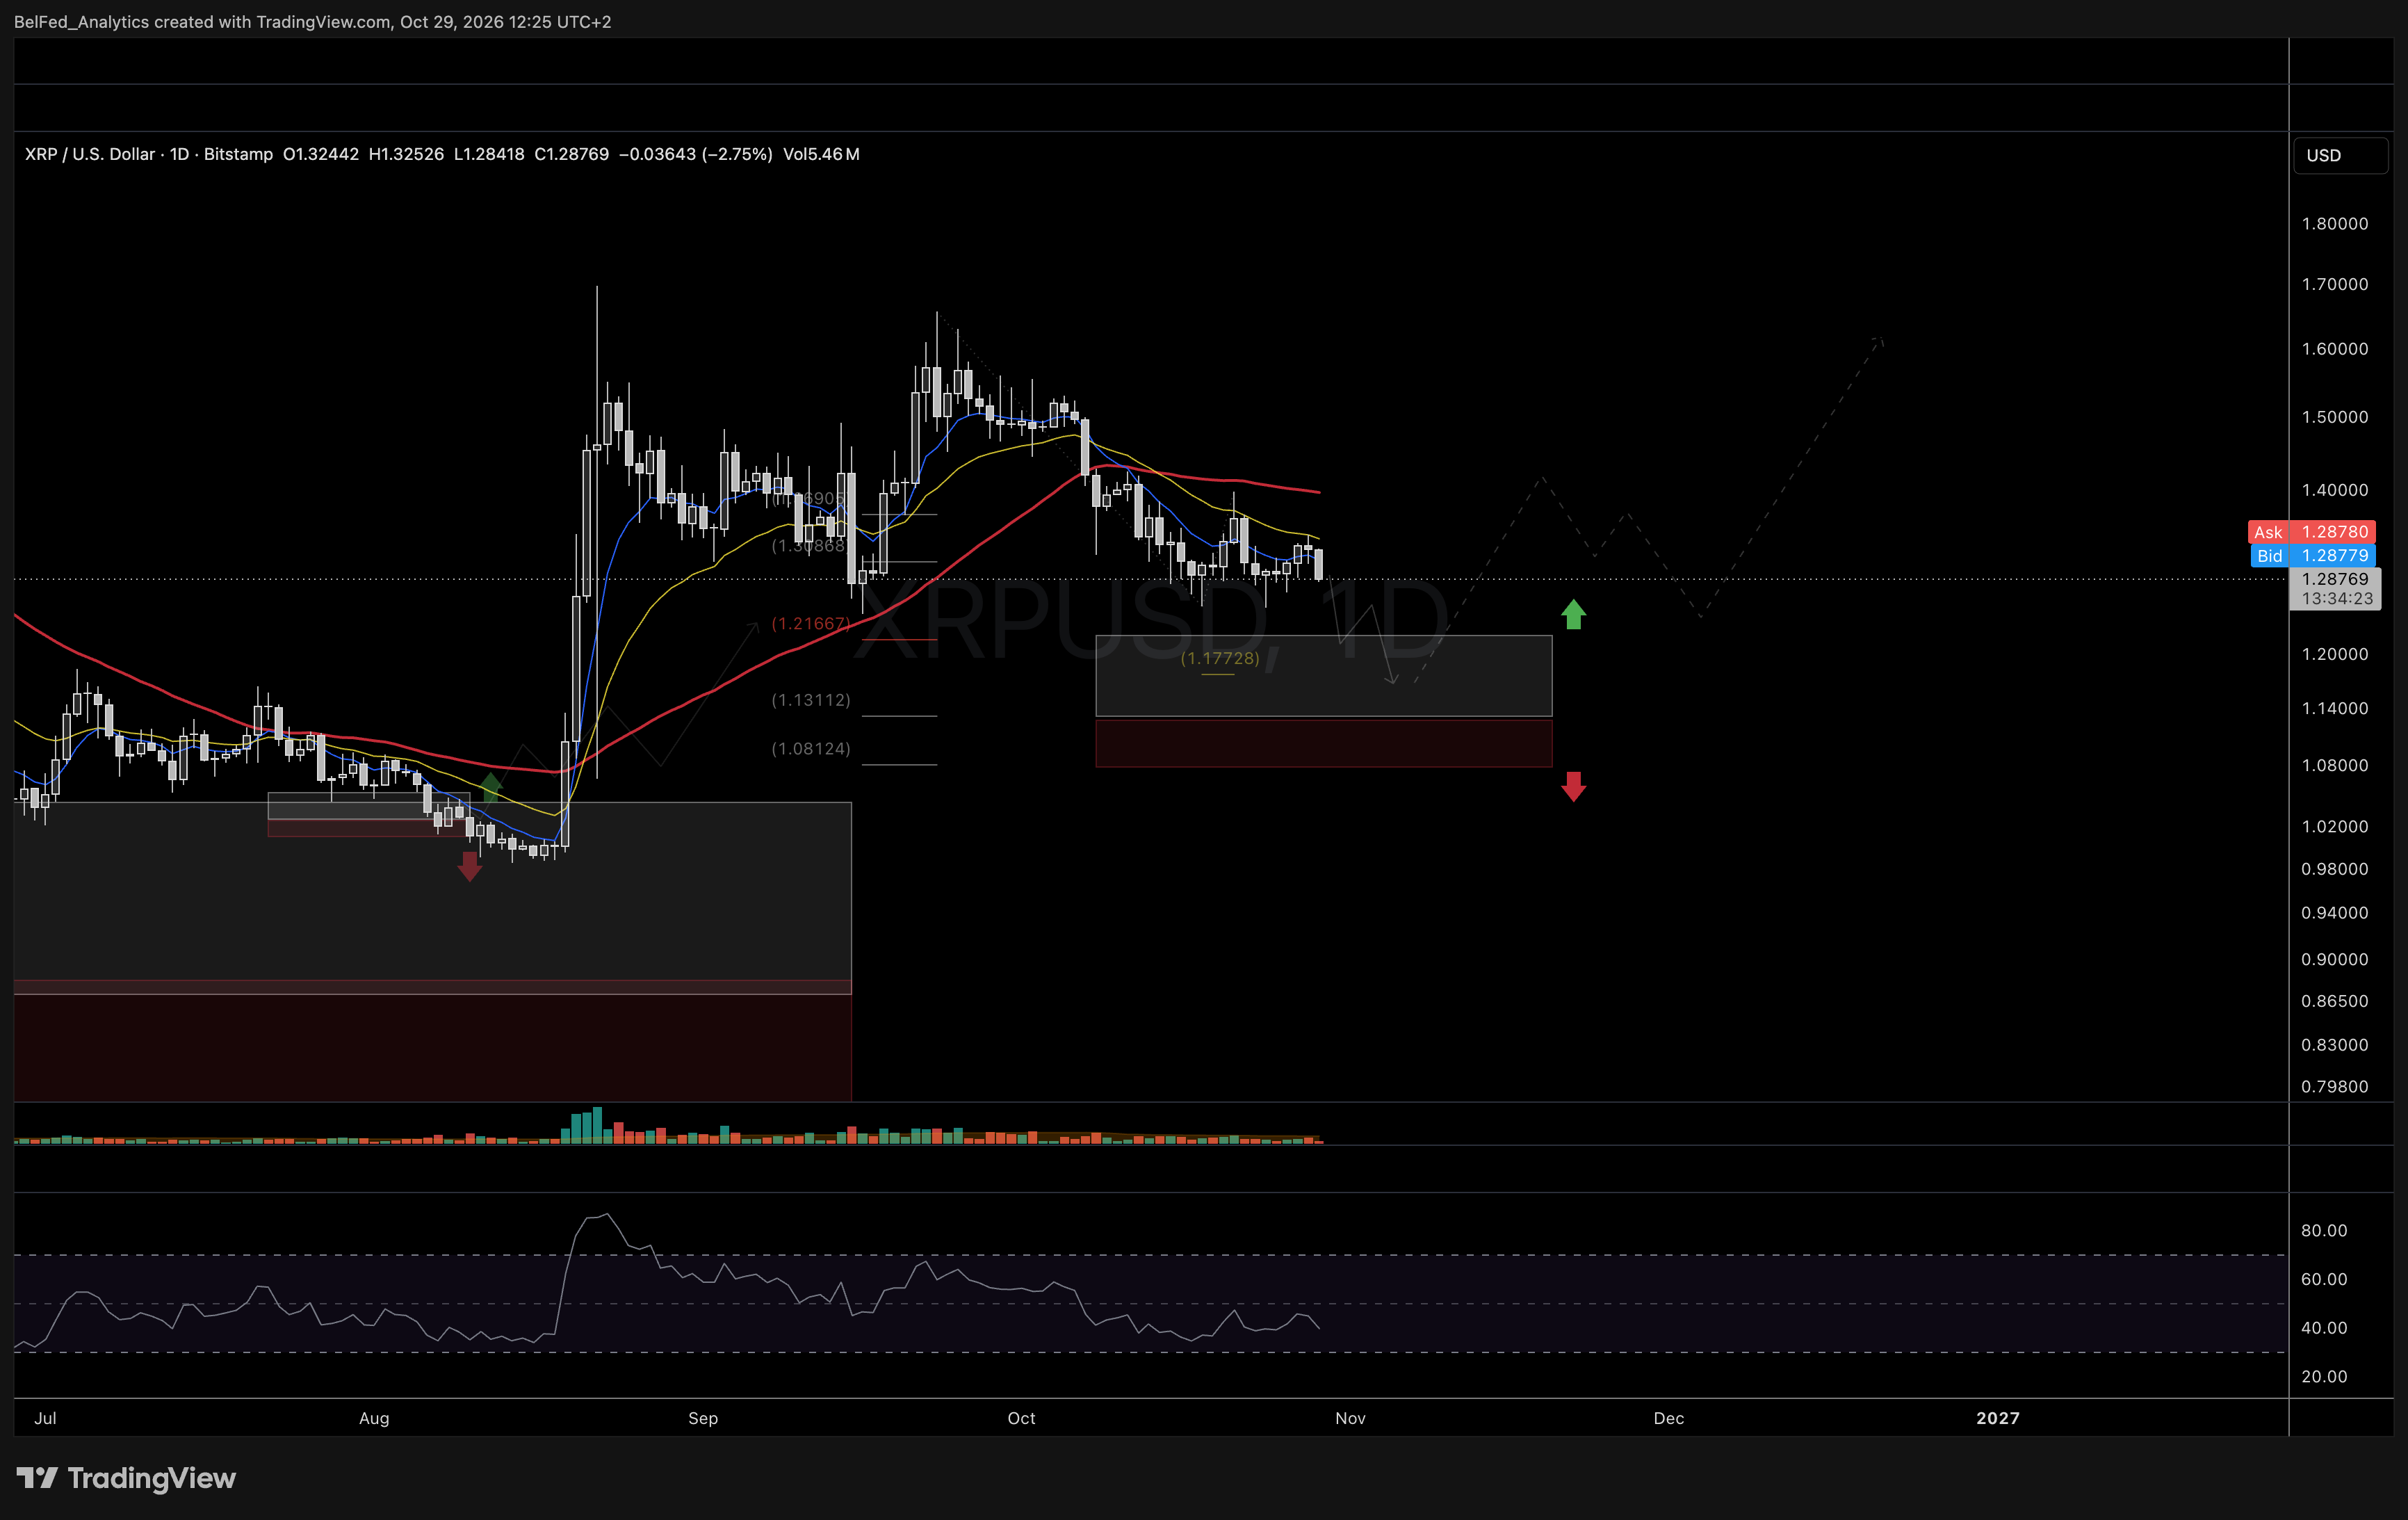
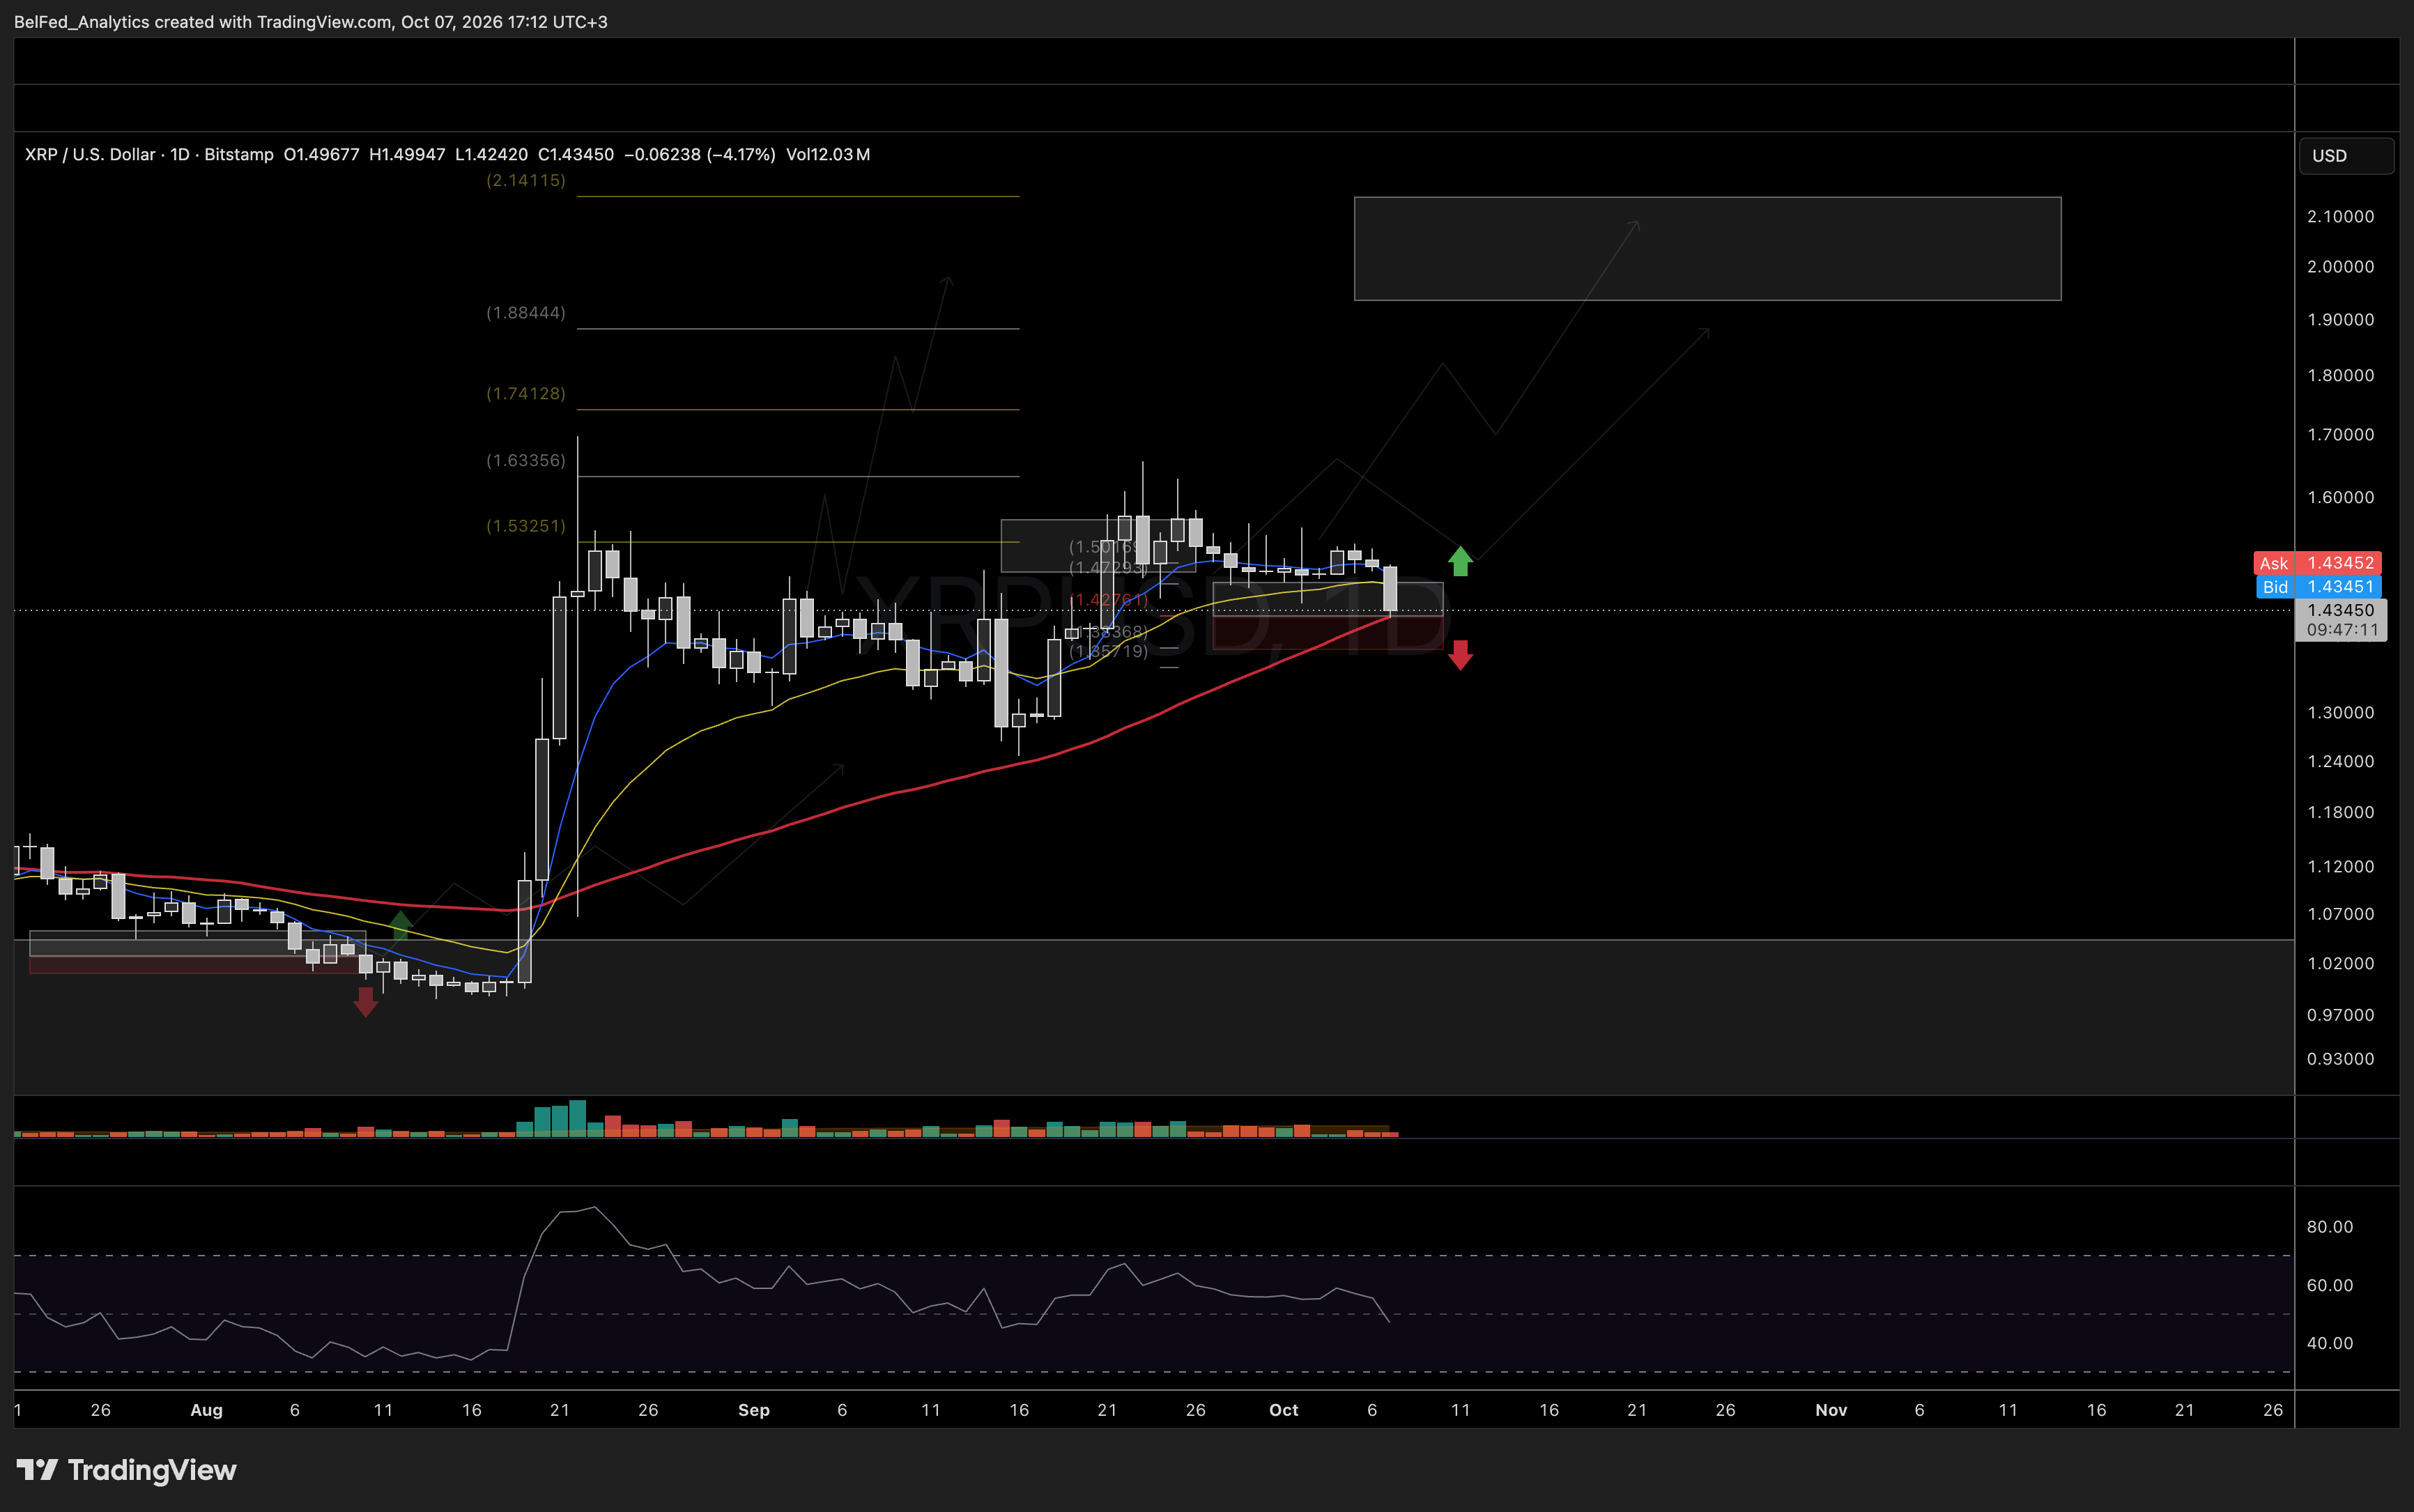
Price is developing a more complex corrective structure. We still consider the move from the August low to have completed the first wave of a new uptrend. The way price has been consolidating since the August high looks constructive for the medium- and potentially long-term bullish trend structure we are tracking.
In the short term, however, as long as price remains below yesterday's high at 1.35, we expect further downside that can target the 1.22–1.17–1.13 medium-term support levels before the entire corrective structure from the summer top completes.
010
HYPE: Trend Structure and Our Expectations
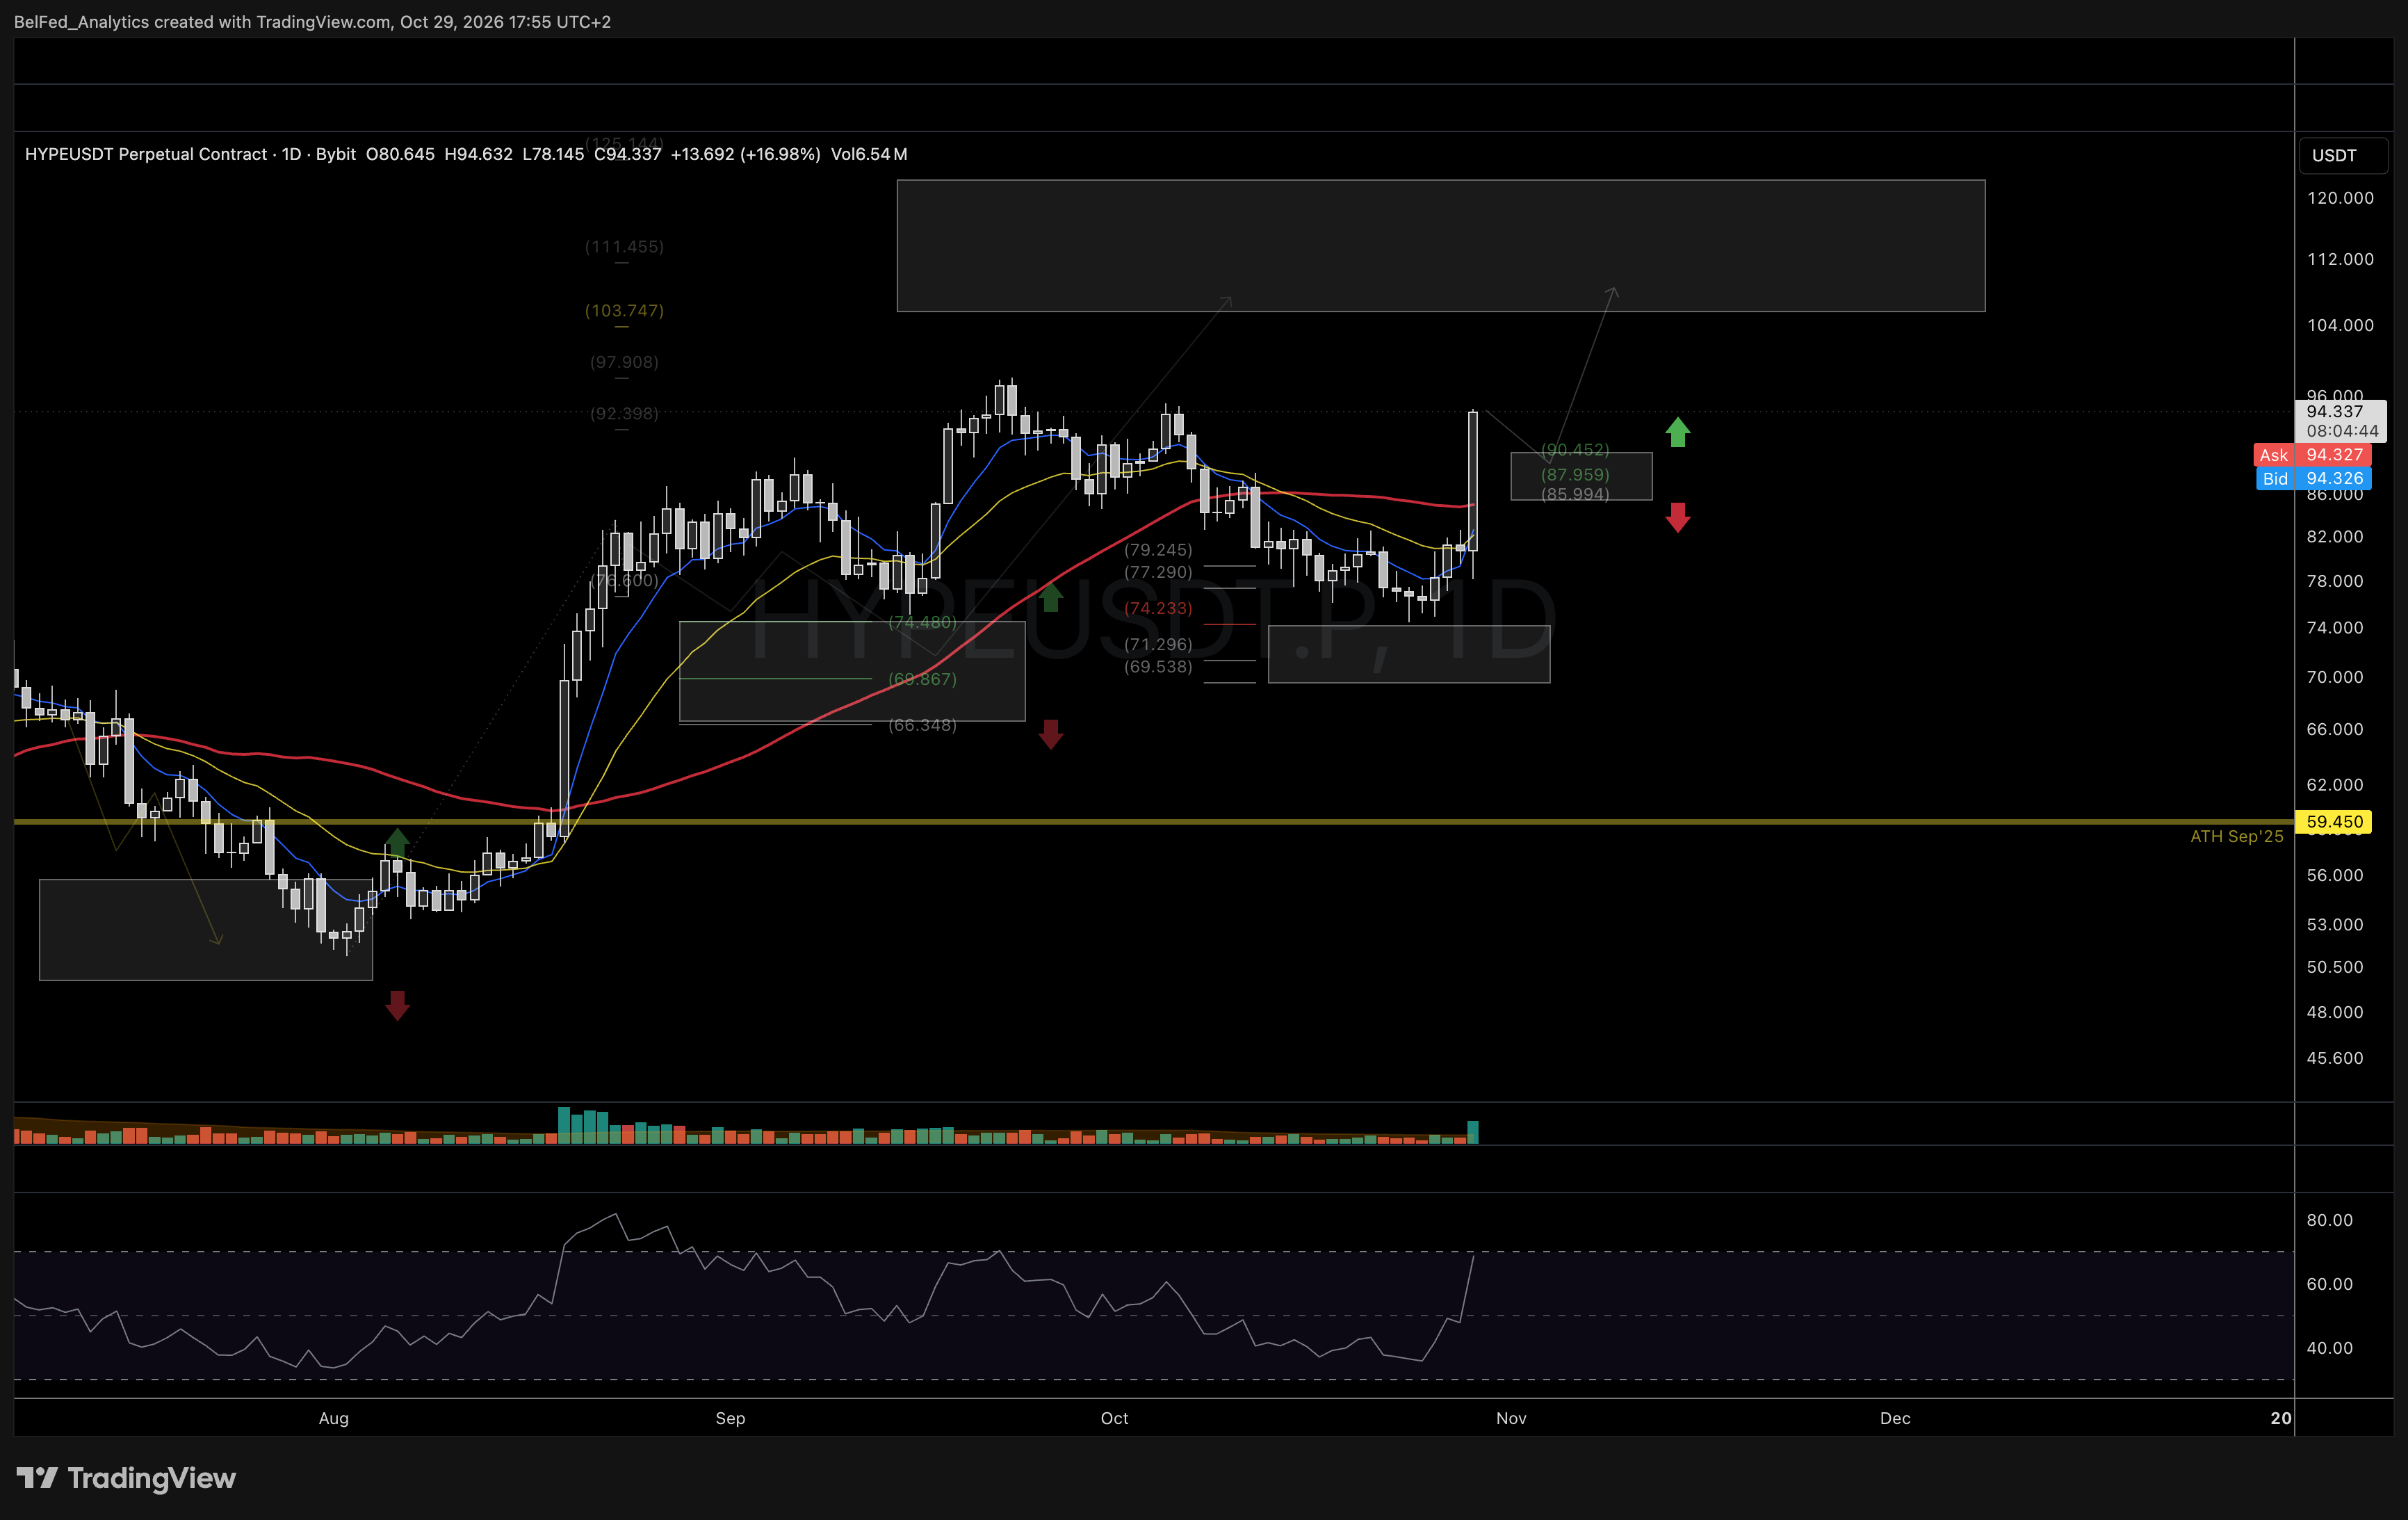
We are seeing very strong, leading action in Hyperliquid today, supported by news that NYSE parent Intercontinental Exchange (ICE) is partnering with TradeXYZ to launch a regulated U.S. perpetual futures market on Hyperliquid's infrastructure. Provided that price holds the majority of these gains into today's close, this move serves as strong evidence that a new upside wave is starting.
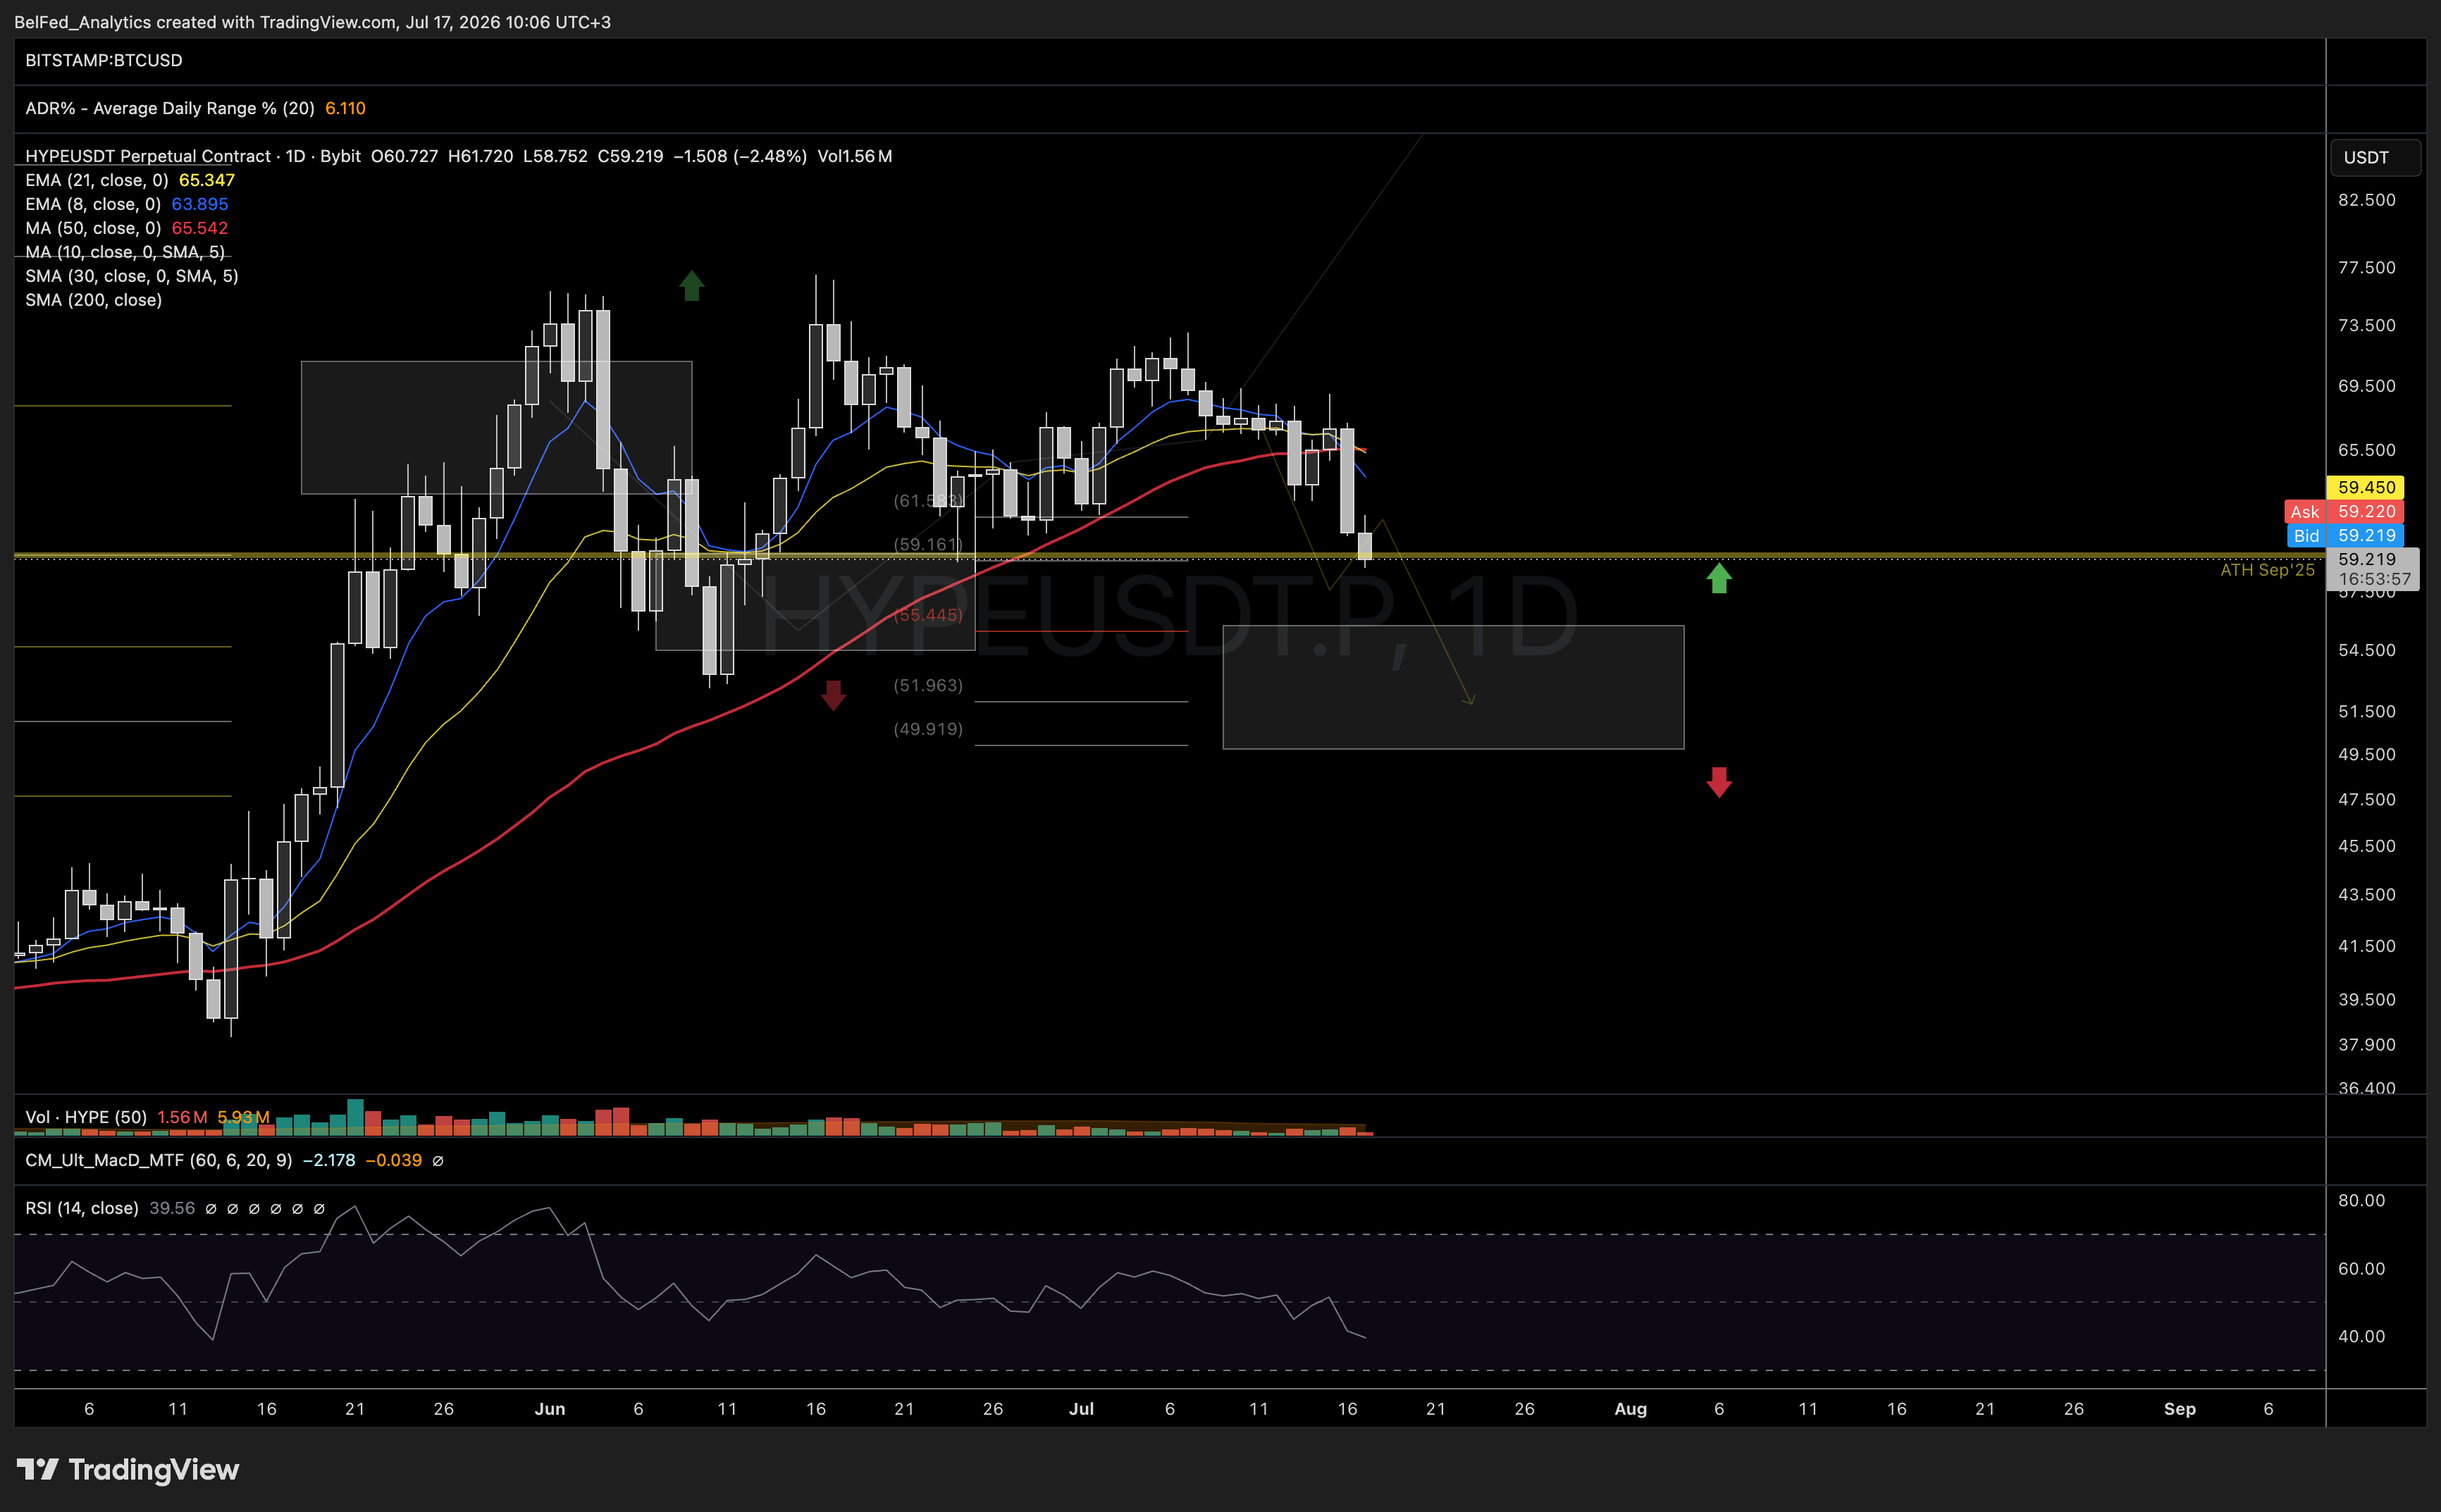
However, we would prefer to see at least several days of sideways consolidation that holds within the 90–85 support zone to digest today's range expansion before another push higher into the major medium-term resistance zone at 103–120.
011
October Results: Closed Positions
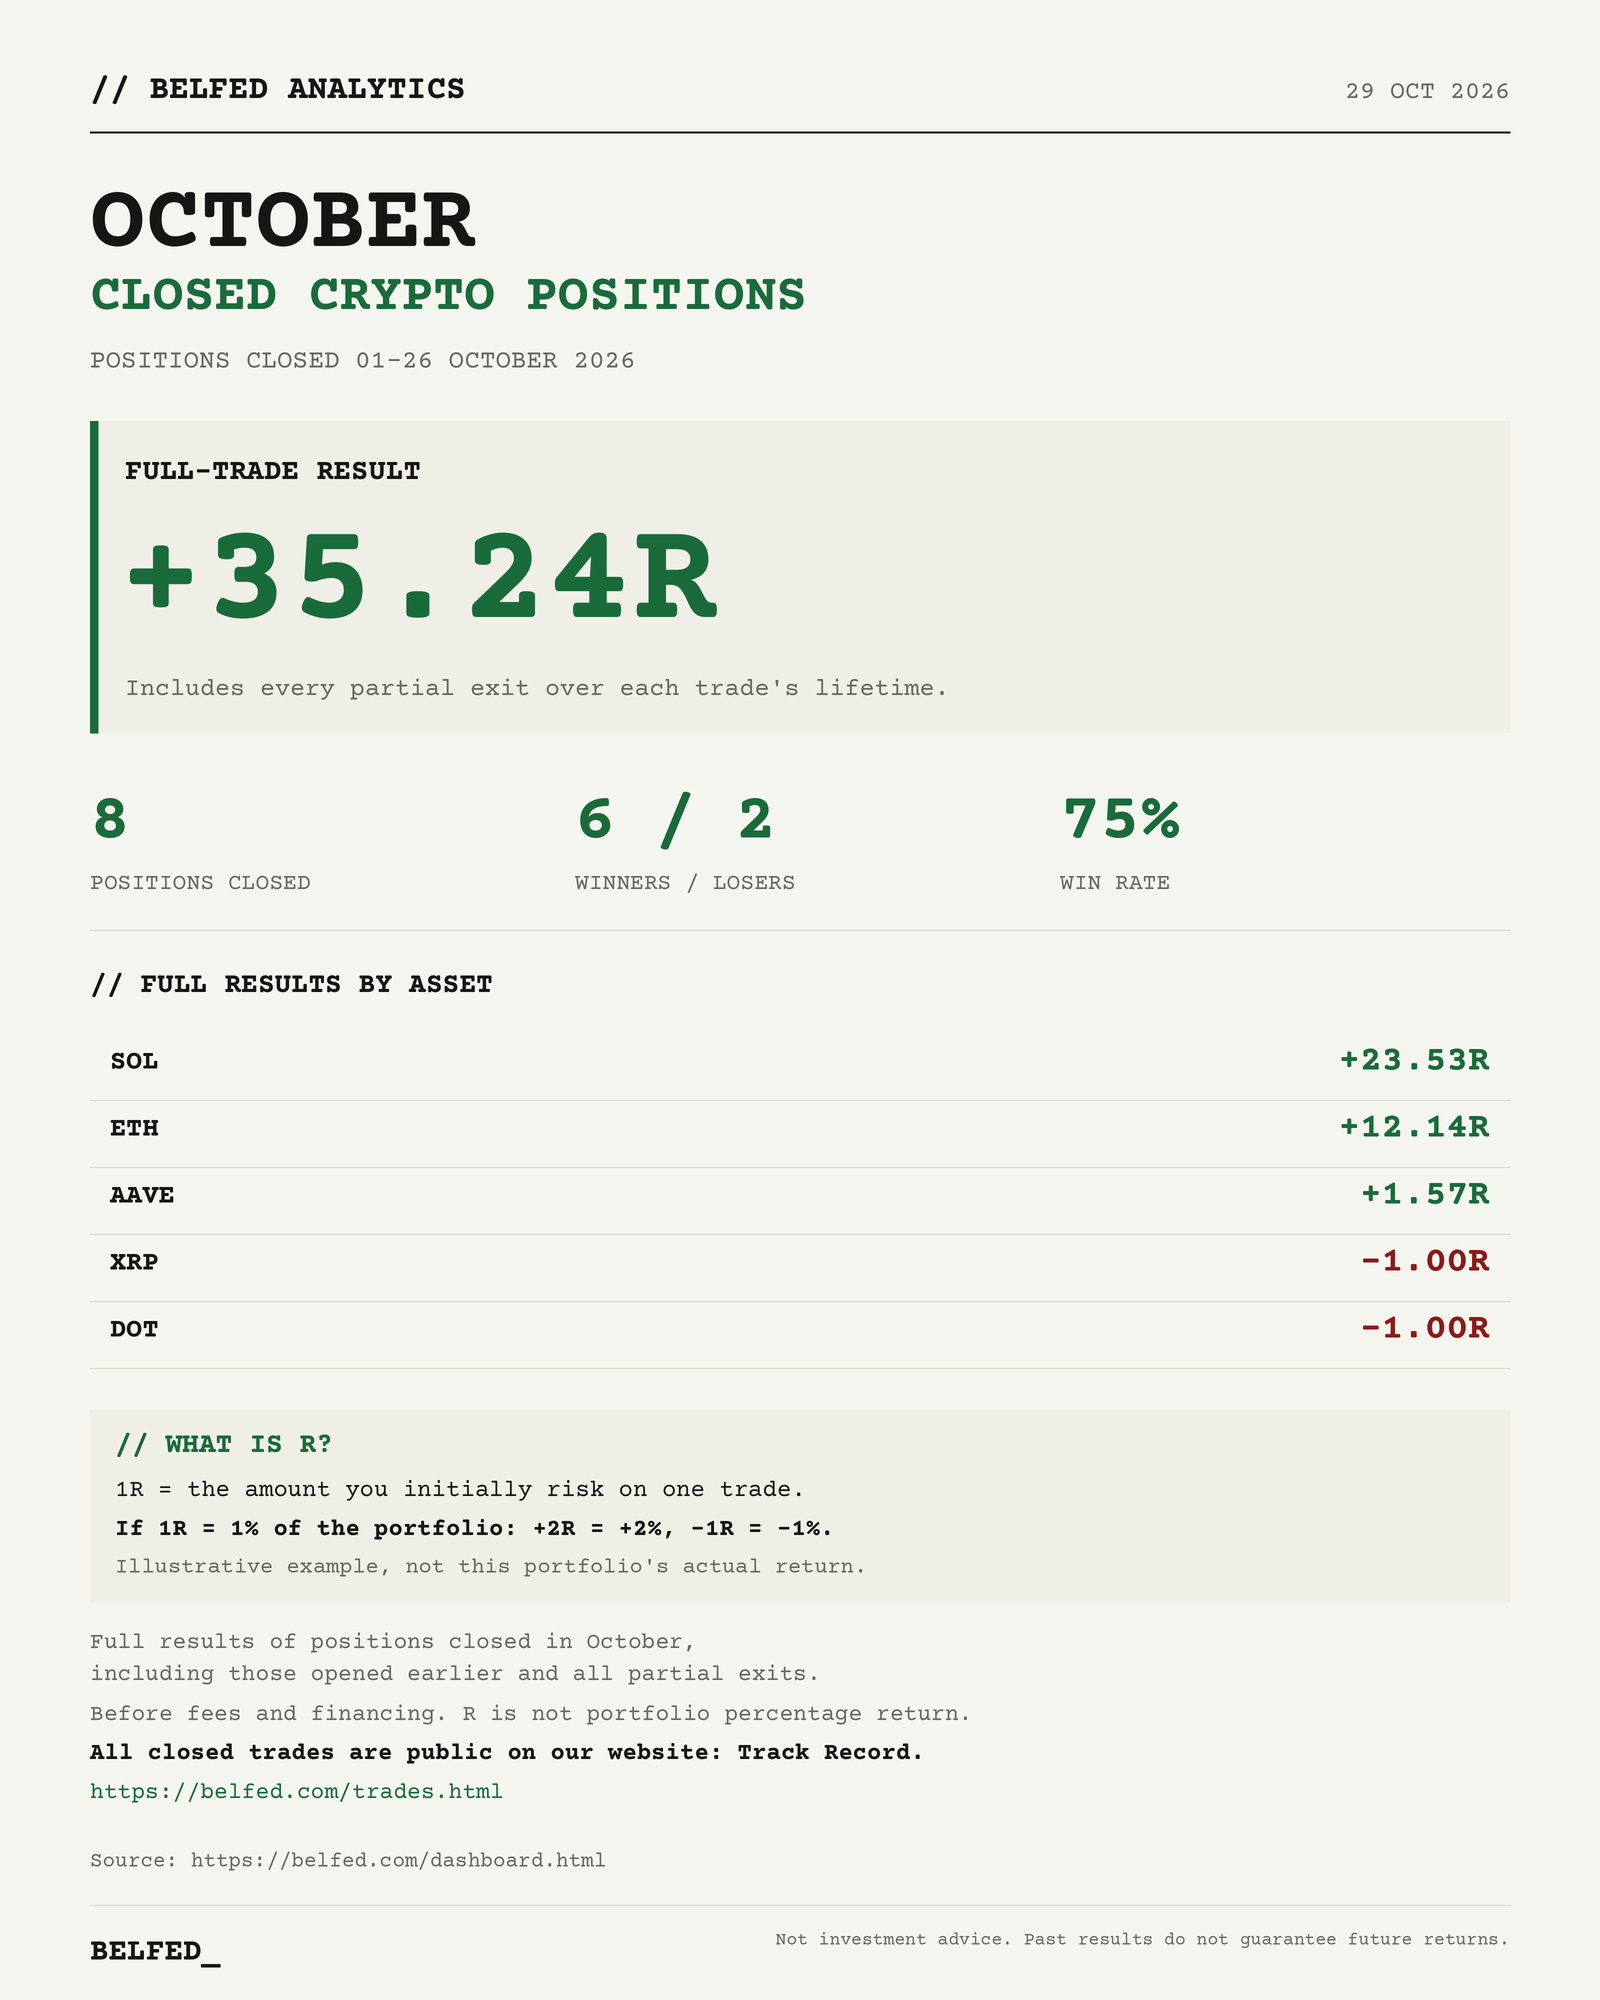
Between October 1 and 26 we closed 8 crypto positions: 6 winners and 2 losers. The combined result, including all partial take-profits, came to +35.24R. SOL (+23.53R) and ETH (+12.14R) contributed most, AAVE added +1.57R, while XRP and DOT were stopped out at −1R each.
For context: 1R is the initial risk per trade. The figure includes partial exits taken before October, excludes fees and funding, and is not equal to portfolio return.
Every trade the service takes — open and closed — is published on the Belfed website in the Track Record section, where you can check any position: entries, stops, partial exits and the final result. See: https://belfed.com/trades.html
012
History of Closed Crypto Positions
Every trade featured in our October results card is available in the public Track Record. Direct links to each position:
SOL · entered 8 Aug 2026
https://belfed.com/trades.html#trade-sol-long-2026-08-08-2026-10-12
SOL · entered 18 Aug 2026
https://belfed.com/trades.html#trade-sol-long-2026-08-18-2026-10-12
SOL · entered 20 Sep 2026
https://belfed.com/trades.html#trade-sol-long-2026-09-20-2026-10-12
ETH · entered 17 Aug 2026
https://belfed.com/trades.html#trade-eth-long-2026-08-17-2026-10-12
ETH · entered 20 Sep 2026
https://belfed.com/trades.html#trade-eth-long-2026-09-20-2026-10-08
AAVE · entered 25 Sep 2026
https://belfed.com/trades.html#trade-aave-long-2026-09-25-2026-10-12
XRP · entered 2 Oct 2026
https://belfed.com/trades.html#trade-xrp-long-2026-10-02-2026-10-02
DOT · entered 30 Sep 2026
https://belfed.com/trades.html#trade-dot-long-2026-09-30-2026-10-07
14 days free: trades, research, and on-demand asset analysis
Join Belfed Analytics on Telegram to stay updated on all of our trades in real time, receive regular market research, and submit daily requests for analysis on the assets you follow. Your first 14 days are free—no credit card required.